Esri Technical Support Blog

cancel
Showing results for 
Show  only  | Search instead for 
Did you mean: 

Other Boards in This Place

Latest Activity

(383 Posts)
RachelApplebaum
Esri Contributor

Have you ever tried to get a route between several points in ArcMap and received the message "Warning: Location X in 'Stops' is on a non-traversable network element position"? You do a little research and find out you need to enable the setting "Exclude restricted portions of the network". Even after turning that setting on, you still get the error. What's going on?


If you try the same route in ArcGIS Pro, there’s no error message. And you can't find the “Exclude restricted portions of the network” setting anyway.


What's going on? What is the problem here? And what is the difference between ArcMap and ArcGIS Pro?


The problem that's preventing the stop from being on the route is with the network location.

What is the network location? Per Esri Help documentation, “a network location is a type of network analysis object that is tied to the network; furthermore, its position on the network is input for the analysis." (Network Locations, http://bit.ly/2gfVM6m). In plain terms, it's where ArcGIS Network Analyst routes to.


When ArcGIS Network Analyst solves a route, Network Analyst doesn't route to the XY location of the point. Instead, the extension will snap the point to the nearest street and calculate some location values on that street. That location is the network location.

The network location can be seen in four fields*: SourceID, SourceOID, PosAlong, and SideofEdge.

  • SourceID: This will be the name of the source feature class that the network location is on.
  • SourceOID: The OID of the source feature that the network location is on in the source feature class.
  • PosAlong: The position along the digitized direction of the source line feature**. The number is expressed as a ratio, between 0 and 1. For example, a PosAlong value of 0.557 indicates that the location is 55.7% down the line.
  • SideOfEdge: The side of the line that the original XY location is on with reference to the digitized direction of the line.

The message "Warning: Location X in 'Stops' is on a non-traversable network element position" indicates that the network location for that point is on a street that is considered prohibited or non-traversable. Some examples of a location that is on a prohibited street include, but are not limited to:

  • The analysis has been set so that it simulates driving a car, and the network location is on a pedestrian-only street.
  • The stop is on the right side of a one-way street which is prohibited in the "along" direction***.
  • The network location is on an unpaved road, and unpaved roads are prohibited in the analysis.

You can use the Network Identify tool on an edge in the network dataset to see which network attribute restrictions (like one-way or unpaved roads) would cause the edge to be traversable or prohibited.

So, the network location is on a prohibited network edge. What do you do about that? Let's continue by looking at the "Exclude restricted portions of the network" setting, since that's the setting we use to fix the error.

The "Exclude restricted portions of the network" setting causes network analysis objects to locate only on elements that don't have active prohibit-restrictions, which are restrictions that are checked in the Analysis Settings tab. With this on, then a network location will not be placed on any edge considered prohibited at the time.

How does it work? If the "Exclude restricted portion of the network" setting is on when ArcGIS Network Analyst is calculating the network locations, ArcGIS Network Analyst will skip any street considered prohibited and find the closest street which is traversable.

Let's go back to the example of the analysis being set up to simulate driving a car, and the point is closest to a street marked as pedestrian-only. Getting more specific, let's say I work for a pizza delivery service. A customer called and ordered a pizza. They live in a college dorm, which is located on a pedestrian walkway. If I have the "Exclude restricted portions of the network" setting enabled when I load the point for that location, I'll get a route. And I'll see that it's not taking me to that pedestrian walkway; it's taking me to a point on the main road through the campus. From there, I'll park on the side of the road, get out and walk to the dorm to deliver the pizza. Then go back to my car and continue the route.

This setting is where we see one of the biggest differences in network locations between ArcMap and ArcGIS Pro. Let's start with ArcMap.

ArcMap


In ArcMap, all network location settings are accessed through the Network Locations tab of the network analysis Layer Properties****.

The order of changing settings related to network location matters because network location settings in ArcMap are not retroactive—they don’t go back and change any network locations already calculated. So, if you change a network location setting after loading your locations, you'll need to recalculate the network locations.

By default, ArcGIS Network Analyst in ArcMap does not use the "Exclude restricted portions of the network” setting, so you will need to turn it on. Either turn it on before loading the locations or after—if after, be sure to recalculate the network locations before solving.

In the situation described in the beginning of this blog, the "Exclude restricted portions of the network" was turned on, but the network locations were not recalculated. Here are some example steps to follow to ensure stops are included in the route:

  1. Load the locations into the analysis layer.
  2. Turn on "Exclude restricted portions of the network".
  3. Make any remaining changes to the analysis settings, including which restrictions are turned on or off.
  4. Recalculate the network locations *****.
  5. Solve

ArcGIS Pro

ArcGIS Pro has more advanced network location settings. All settings are found in the Add Locations geoprocessing tool, which loads the points into the network analysis layer and calculates the network locations. So, it makes sense that the network location settings are found in the Add Locations geoprocessing tool.

But wait, where is the "Exclude restricted portions of the network"? It's not gone; it's still there. In fact, ArcGIS Pro turns it on by default, so it's always in effect. Also, ArcGIS Pro automatically recalculates network locations for locations affected by setting changes automatically before the solve. So, you do not need to manually recalculate locations in ArcGIS Pro; it does it for you.

These are some of the most used settings to keep in mind when working with ArcGIS Network Analyst, but there are many more. I encourage you to check out the settings and see how they can improve your network analysis.

Resources:

For points. Network locations for lines and polygons (for barriers, route zones, etc.) are stored in a single blob field and cannot be easily read.

** One of the easiest ways to see the digitized direction of a line is to add an arrow at the end of the line symbology. In ArcMap and ArcGIS Pro, there is a default symbology called “Arrow at End” that can be used.

*** “Along” indicates travelling with the digitized direction. “Against” indicates travelling against the digitized direction.

**** Common ways to access the network analysis Layer Properties are either double-clicking the analysis layer name in the Table of Contents or by clicking the Layer Properties box in the top-right corner of the Network Analysis window.

***** To recalculate the network locations, right-click the sublayer in the Network Analysis window, and choose Recalculate Location Fields.


more
3 0 4,765
AlanRex1
Esri Contributor

In a previous blog post, my esteemed colleague and board game nemesis Kelly Gerrow-Wilcox discussed the basics of capturing web traffic in a web browser using the built in browser developer tools.  But what about when you’re consuming services in ArcGIS Pro, ArcMap or any other non-browser client?  Enter: web traffic capturing tools.  There are numerous free tools (such as Fiddler, Wireshark, Charles and others) which allow users to capture web traffic from their computers.  This blog will focus on capturing HTTP/HTTPS traffic using Fiddler.  I've chosen Fiddler because of its relatively simple interface and broad adoption within Esri Technical Support. 

Basics: download, configuration and layout

Fiddler can be downloaded here.  After installation, the only critical configuration that needs to 
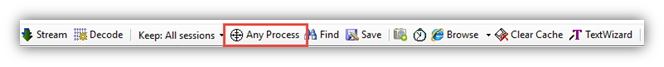
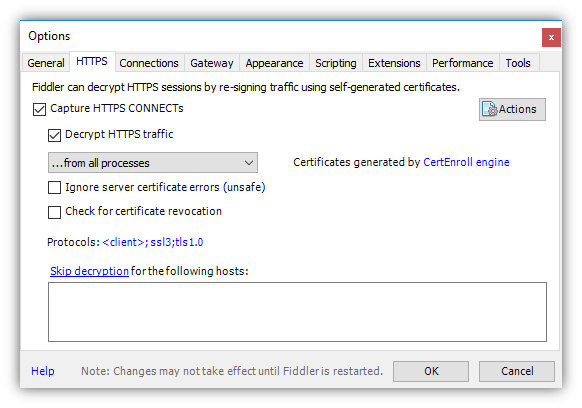
occur is to enable it to capture traffic over HTTPS.

  1. With Fiddler open go to Tools > Options
  2. In the pane that opens, check Capture HTTPS CONNTECTs and Decrypt HTTPS traffic. (This allows you to capture any requests sent using HTTPS, which is slowly but inevitably replacing HTTP as the protocol for transferring data across the web). 

If it’s necessary to capture network traffic from a mobile device, some extra configuration is required.  Both the mobile device and the machine where Fiddler is installed will need to be using the same wifi network.  The following documents outline the steps to capture mobile traffic:

The Fiddler application itself is split into two main sections; the Web Session
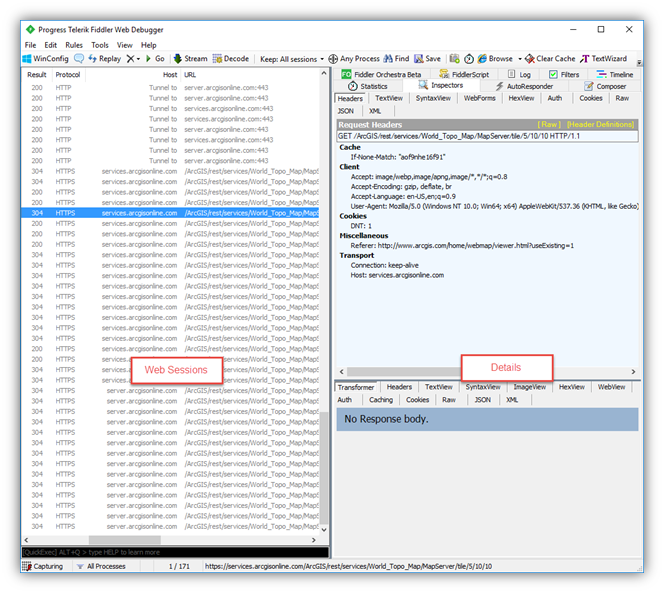
s list and the…other pane (I couldn’t find an official name so for the purposes of this blog we’ll refer to it as the Details pane). 

The Web Sessions pane includes a sequential list of every request sent by the client to a web server.  Important information contained here includes:

  • The type of protocol used (HTTP or HTTPS)
  • Which server the request was sent to, and the full URL
  • The HTTP/HTTPS response code (here’s a description of what these mean)
  • The size of the body of the response (in bytes)
  • The content type (image, text, etc)


Note: the columns in the Web Sessions pane can be custom configured by right clicking anywhere in the headers and selecting Customize Columns.  Some useful fields to turn on can be:

  • Overall Elapsed (available under Collection: Session Timers. This is the overall time it takes for the request to be sent and returned)
  • ClientBeginRequest (available under Collection: Session Timers. This is the time your software first began sending the request, using your computer’s time)
  • X -HostIP (Select Collection: Session Flags and manually enter in the Header Name. This is the IP address of the server destination of the request)


If you click a single web session, that triggers the Details pane to populate with a wide variety of information for that specific request. 


Intermediate:  What do these details mean? Do they mean things? Let's find out!

There are numerous tabs in the Details pane.  The most useful (for our purposes) are Timeline, Statistics, and Inspectors.  The others are all advanced functionality outside of the scope of this blog.


The Statistics and Timeline tabs are both helpful when investigating any performance related issue, for example if a service is taking a long time to load in the Map Viewer.  The Timeline tab is useful for identifying which request in a multi-request process is acting as a bottleneck.  To utilize the Timeline tab, select multiple requests in the Web Sessions list.  The timeline will display the requests in a sequential “cascade” format.  Any requests taking an unusually long time will clearly stand out with a significantly longer bar in the timeline.


Statistics displays the exact times every step of the request took, from the client initially making a connection to the last step of the client receiving the response.  This breakdown is useful to potentially identifying which step in the process of a single request is acting as a bottleneck.  For example, if every step is taking a fraction of a second, but there is a multi-second pause between ServerGotRequest and ServerBeginResponse that would indicate that something on the server side is causing a slowdown. 


Lastly, the Inspectors tab is the where the bulk of information is displayed and likely where the vast majority of any troubleshooting will be done.  Here is where the curtain is drawn back to reveal the nitty gritty of how applications interact with web services.  Inspectors is further divided into two main sections; the Request information (everything related to the request sent by the client) and the Response information (everything related to the response returned by the server).  Both divisions have a nearly identical set of subdivisions which display the content of the request/response in different formats.  Below are the useful tabs for our purposes:

  • Headers – A list of additional information that is not part of the main request. This may include information like security/authentication information, the data format of the request or response, the type of client making the request, etc. This is a good place to find an ArcGIS Online token, when relevant.
  • WebForms (request specific) – Depending on the type of request, this will display a breakdown of each request parameter and the value of that parameter. For example, when submitting a search query this section will display the parameters of the query (like keywords, date ranges, etc).
  • ImageView (response specific) – If the request is for an image, the ImageView will display the image which is returned. Obviously, this is particularly useful for requests involving tiled services.
  • Raw – This will display the entire request or response in text format.
  • JSON – If the request/response includes content in JSON format, this tab displays the content in a more human readable format. This is particularly useful for requests/responses to the REST api of ArcGIS Enterprise servers.
  • XML – If the request/response includes content in XML format, this tab displays the content in a more human readable format. This is particularly useful for requests/responses to OGC services.

Advanced: That’s great Alan.  But what am I supposed to actually do with this information? 

How you use network traffic information is going to depend on what you’re trying to learn or solve.  Checking network traffic can help identify the where and what of a problem but cannot tell you the solution.  This is where your knowledge of your app, your web services and if all else fails, some good old fashioned web searching come into play.  Here are a few common examples of ways to isolate the problem you’re facing:


  • Check the HTTP/HTTPS response code in the Web Sessions pane. Anything that isn’t 200 should be investigated (it might not necessarily be a problem, but it’s worth looking at).  Again, here’s a description of what these mean.  Even a 200 response could contain error messages or other useful information.
    • A 304 response from a server will trigger the client (web browser, ArcMap, etc) to use the client’s cache and Fiddler is therefore not actually capturing a complete response from the server. If there is a 304 response on a critically important request, try again either in Incognito mode or clear your client’s cache. 
    • A 401 or 403 response typically mean the server requires some sort of authentication. This would help, for example, identify an unshared feature service in a web map which is shared publicly. 
    • A 504 response typically means something timed out. Use this in conjunction with the Timeline, Statistics and Overall Elapsed column mentioned above to troubleshoot performance issues.

  • If you can’t find the problematic request, open the Raw, JSON or XML tabs of the response and just scroll through the requests looking for one that returns an error.
    • Raw, JSON and XML contain the exact same information, just formatted differently.
    • When errors occur, the error listed in the response may be more detailed than the error provided in the user interface of whichever application was being utilized.

  • Find a way to ignore irrelevant requests!!
    • One of the most challenging factors in troubleshooting network traffic is the volume of requests that are sent/and received for even minor actions. Below are strategies to help avoid cluttering your log with unnecessary requests.
      • Turn off Capture (File > uncheck Capture Traffic) when you know Fiddler’s not capturing relevant information.
      • Close any browser windows or background processes that don’t need to be running.
      • If Fiddler is capturing traffic you know is not related to what you’re investigating, Filter it out of the Web Sessions by right clicking a session > Filter > select what session parameter you want to filter.
      • If you’ve captured a number of requests that you know you don’t need, select and delete them.
      • Target Fiddler to only capture requests from a single application by clicking the ‘Any Process’ button (next to the small bullseye icon), holding and then releasing your mouse over the application you want to capture from. This would be useful, for example, to capture all traffic coming from ArcMap while ignoring everything that occurs with your browsers. 


Once you have isolated the request(s) relevant to the issue you’re investigating, the following tips can help determine what the actual problem is.

  • If you can isolate the problematic request, consider what is the nature of that request in order to help determine any next steps.
  • It’s possible to resend any requests by right clicking a Web Session > Replay > Reissue and Edit.
    • This is especially helpful for isolating a specific header or request parameter that might be problematic. Modify the information under WebForms or Headers to see if that fixes the problem you’re encountering or reproduces the problem you’re investigating.
    • If you have a request that’s succeeding and one that’s failing, copy the headers or WebForms parameters one at a time from the request that’s working to the request that’s failing. Once the request works, you’ve successfully isolated the parameter/header in the requests that’s causing the problem.
  • It’s possible to send repeated requests by right clicking a Web Session > Replay > Reissue Sequentially.
    • This is helpful for capturing issues which might be intermittent. Send the request 20 or 30 times automatically and see if hit the issue you’re looking for.
  • Web service query requests can be viewed in the browser with a user-friendly interface. This allows you to easily tweak and resend requests.  To view a query request in the browser:
  1. Right click the query session
  2. Copy > Copy the URL
  3. Paste in a browser window
  4. Change the section in the URL “…f=json…” to “…f=html…”
  5. Click enter to browse to the page


Fiddler and other network capture software are not silver bullets to solve all web traffic related GIS issues, but they are useful tools to help.  With a bit of practice, utilizing this type of software can help resolve a wide variety of issues when accessing web services in GIS applications. 

Got any good Fiddler (or general network traffic logging) tips?  Feel free to leave them in the comments!

more
23 11 26.6K
Sharadarya
New Contributor

I am using SQL server 2012 SP1 and created the SQL Query Layer and once I open it in ArcMap 10.3.1 then I find few feature disappeared at the bottom. Also, I do pan the map to the bottom and do refresh the map ,features get disappeared. I search the same issue in Google and find out the below URL :

http://desktop.arcgis.com/en/arcmap/10.3/manage-data/gdbs-in-sql-server/sqlserver-spatial-types-and-...

Is it the same issue with SQL Server 2012 also.

Is any map frame defined for query layer in which data can not be displayed beyond that.

Your help would be highly appreciated.

more
0 0 861
JuliaLenhardt1
New Contributor III

Exciting things are coming for GIS users in 2018 - ArcGIS Desktop 10.6 and ArcGIS Pro 2.1 are being released in January, along with some great new tools, features and functionality. Esri Technical Support is excited to work with our customers in these new environments, but what does this mean for some of the older platform versions?

Alas, on January 1, 2018, ArcGIS 10.1 is officially retired

Here's a quick list of what this entails: 

  • Technical Support will not be available for ArcGIS Desktop 10.1, ArcGIS Server 10.1, or Enterprise GDBs at 10.1
  • It will not be possible to request a Support Case for ArcGIS Desktop/Server/Enterprise 10.1
  • We are here to help you with upgrading. If you need technical support for the upgrade process, give us a call. 

As this year comes to a close, it's important to plan ahead. Get a jump start on upgrading your applications and geodatabases, and reach out to us if you have questions. 

For more information, check out some of our documentation:

Product Life Cycle for ArcGIS 10.1

Deprecation Plan for ArcGIS 10.1 and ArcGIS 10.1

more
3 3 1,391
KristaMcPherson
Esri Contributor

This blog post is part II of the WWTSD blog series from Esri Support Services. Click here to view the first part in the series: WWTSD (What Would Tech Support Do?) Part I.

Have you ever attempted to run a geoprocessing tool, only to have the tool fail? Perhaps your data fails to publish to ArcGIS Online or draws incorrectly on your map. Maybe you are running a geoprocessing tool only to have it fail with a generic error message. You are using the same workflow you use every day with the same settings and configuration, but you can't seem to find another cause to the problem.

You may be dealing with a data-specific issue. There are a few basic troubleshooting steps that may provide a resolution to this, but it all starts with determining if the issue is truly data-specific. Determining if an Issue Is Data-specific

A quick test to determine if an issue is data-specific is to bring your dataset into a blank map document, map frame, or web map (depending on the environment in which you are working). If the issue does not persist in a new map, then the issue may be specific to the map document. If you experience the same issue in a new map document, the source of the problem may be the data.

Another way to determine if an issue is data-specific is to run the same process with a different dataset similar to the one that you are using. For instance, if using a point shapefile that fails to import into your file geodatabase, run the process on a different point shapefile of a similar size. If the tool or process succeeds on the new dataset, then the issue may be data-specific. Luckily, there are tools available that can help to resolve some of these data-specific issues.

If you find that the problem or error is reproducible with multiple datasets, you may want to investigate some of our additional resources to determine the source of the issue. Feel free to check out more resources from the first post in the WWTSD series (linked above).Possible Data-specific Issues and Their Solutions

A geometry error can be one potential source of a data-specific issue that has a quick fix. ArcGIS applications require that a feature's geometry meets certain standards. Issues can occur if any features have null or incorrect geometry. In ArcMap and ArcGIS Pro, you can determine if your dataset has any geometry errors by running the Check Geometry tool, which generates a table that lists the geometry errors found in the data. If there are errors present in the resulting table, run the Repair Geometry tool to fix the geometry errors present in the data. It is recommended to make a copy of your data prior to running this tool, as the tool may delete records with geometry errors.

If your features appear in a different location on the globe than you would expect, your data may have an issue with your data's projection. You can view the coordinate system of your data by navigating to the properties of the layer. If the data does not have a defined projection, you may need to use the Define Projection tool to assign the correct projection (see the tool documentation here for more information). If your data has been assigned a different projection than the other layers in your map, you may need to use the Project tool (here) to alter the coordinate system of your data. For more information about when to use the Define Projection tool versus the Project tool, take a look at the blog post found here. If you do not know what projection your data should be in, please see the technical article here for more information.

Data can become corrupt for various reasons, including incorrectly copying data or  experiencing connection issues to a network drive. These issues sometimes can be resolved by exporting the data into a different format or location, such as to a different feature class or to a .tif rather than to a .png raster file. If you are working in a file geodatabase, run the Recover File Geodatabase tool, which creates a new file geodatabase with repaired versions of feature classes that the tool identifies as potentially corrupt. Considerations for Raster Datasets

Raster datasets have many parameters and properties and therefore, many sources of data-specific issues. The following by no means addresses all potential issues with raster datasets, but does address a couple common sources of data-specific issues for rasters and troubleshooting steps to address the issues.

Bit-depth is a characteristic of a raster that defines the possible cell values allowed for the dataset (for more information, click here). If the bit-depths of two or more rasters that you are running a geoprocessing operation on do not match, you may run into errors or issues. For instance, if you create a mosaic dataset containing rasters from multiple sources, you may want to confirm that the bit-depths of the rasters are the same. You can determine the bit-depth of a raster by navigating to the raster properties. If you must change the bit-depth of your raster, you can use the Copy Raster tool to manually set the necessary bit-depth and create a new output raster with those parameters.

When adding a raster dataset to a map document or creating a new one, you are given the option to build pyramids that control how the dataset is viewed at different scale levels. If you are unable to view your raster dataset at some scale levels, but not at other levels, the raster pyramids may have become corrupt. Exporting the raster into a different format or deleting and rebuilding pyramids may help resolve this issue. If you would like more information about deleting and rebuilding pyramids, click here.Contact Esri Support

These steps can help to begin narrowing down potential causes to an issue, but they may not resolve every potential problem. If you need additional assistance with diagnosing or resolving an issue, feel free to contact Esri Support. We are happy to assist our customers resolve any technical issue they encounter. When contacting Esri Support, please be prepared to provide the following information so that an analyst can assist you as efficiently as possible.

  • Software version and license level
  • Operating system
  • Device, if using a mobile application
  • Synopsis of the issue
  • Detailed workflow
  • Error message
  • Test data

Krista M. - Desktop Support Analyst

more
2 0 1,023
GregoryLehner
Esri Contributor

This blog post provides the latest updates regarding deprecated features in the recent release of ArcGIS 10.5.1.

With each release, Esri assesses and adjusts the products and functionality supported in the ArcGIS Platform based on customer needs and technological trends. The purpose of the Deprecated Features for ArcGIS document is to provide as much advanced notice as possible regarding these changes.

For more information on Esri's plans for deprecating features, refer to the following PDF document, Deprecated Features for ArcGIS 10.5.1 (this deprecation plan is also available in the following technical article from the Esri Support Knowledge Base). The documentation linked above provides additional information about each note below, in addition to recommendations of alternative workflows and applications. Information from previous releases (10.4 and 10.5) is also included in the link above.

Here are some of the major changes in ArcGIS 10.5.1:

  • ArcGIS 10.5.1 is the last release to support Visual Studio 2013 for the ArcObjects SDK.
  • In the near future, the cluster functionality in the ArcGIS Server component of ArcGIS Enterprise will be deprecated. Instead, it is recommended to create separate ArcGIS Server sites where multiple clusters would have been used previously.
  • ArcGIS Enterprise 10.5.1 will stop bundling the portalpy module in favor of the ArcGIS API for Python. No further development is planned for this module.
  • ArcGIS 10.5.1 will be the last release to support the PostgreSQL 9.3.x series of releases, DB2 versions 9.7 and 10.1, and the ST_Raster data type for Oracle, SQL Server, and PostgreSQL.
  • ArcGIS 10.5.1 is the last release to support anything other than the Data Store product as a data store for a Hosting Server.

Note: The deprecation of cluster functionality does not affect the ability to create multi-machine sites. ArcGIS Server sites with multiple machines continue to be fully supported.
Gregory L. - Online Support Resources

more
0 3 2,942
RachelApplebaum
Esri Contributor

clipND_image-300x193.pngImagine this: you've been assigned a project where you must find the drive times (at 5 minutes, 10 minutes, and 30 minutes) for 100 different customers and the best routes to deliver supplies to all customers. On top of that, you'll need to do it for many different datasets. The result of each analysis, along with the underlying data used to produce those results, must be sent to the client.

ArcGIS Network Analyst is the best option, but you'll need your own network dataset. So, you reach out to a colleague or friend. They'd be happy to give you a network dataset, but it contains data for a much larger area than needed. While it may work for your analyses, you can't send the client the whole dataset.

A network dataset containing turn features, sign features, and/or traffic data can be difficult to clip. Using a regular Clip operation on the streets can break connectivity between the streets, as well as break the link between the network edges and the turns, signs, and traffic data.

So, the question is how can you clip the network dataset to a manageable size and keep all the connectivity between the streets, turns, signs, and even the traffic data?

There are a few ways to accomplish this, as outlined in this post. Using Extracted Data from the Distributed Geodatabase Toolbar in ArcMap:

  1. From the Distributed Geodatabase toolbar, select Extract Data. ExtractData.png
  2. In the Extract Data Wizard, check the box to 'Show advanced options for overriding data extraction defaults when I click Next'.ExtractDataWizard1.png
  3. Click Next.
  4. Choose the extent of the data to extract to a new geodatabase (when using an extent smaller than the full extent of the network dataset, the network dataset will be clipped to that extent during the extraction).ExtractDataWizard2.png
  5. Choose the feature classes to extract. By default, all feature classes in the map are checked, and the network dataset is one of those layers.
  6. Click Next > Finish.
Using the Consolidate Layer Geoprocessing Tool in ArcMap or ArcGIS Pro:
  1. In the Data Management toolbox, select Package toolset > Consolidate Layer.
  2. Choose the input layers and the output folder. Choosing the network dataset layer (for example, Streets_ND) brings all source layers with it.
  3. Choose the output format.
  4. Choose the extent of the data to extract to a new geodatabase (when using an extent smaller than the full extent of the network dataset, the network dataset will be clipped to that extent during the extraction).ConsolidateLayer.png
Create Mobile Map Packaging Tool in ArcGIS Pro:Note: This is the best option if you plan to use routing in Navigator for ArcGIS.
  1. Choose the input map(s) and the output location.
  2. Optional: Choose an input locator. If you want to use data in Navigator for ArcGIS, you must use an input locator other than the World Geocoding Service or the default XY locator.
  3. Choose the appropriate extent (when using an extent smaller than the full extent of the network dataset, the network dataset will be clipped to that extent during the extraction).
  4. Check the box to Clip Features.CreateMMPK.png

With all methods above, your data will still allow routing and other network analysis, but will now be a much more manageable size for sharing with others.
Rachel A. - Desktop Support Analyst

more
2 0 5,013
KoryKramer
Esri Community Moderator

Nobody likes to talk about it, but sometimes computers can crash.  Yup, the entire thing just fails and nothing at all can be recovered (if you haven’t backed up your data, go do it now!) Or what if your laptop is stolen, or you flipped your kayak and your machine sank to the bottom of Lake Superior?  You just don’t have it anymore and there is absolutely nothing you can do to get it back. When these types of things happen, any Esri licenses that were authorized on the machine may be lost, too.

In the past, an authorized maintenance contact had to call Esri Technical Support to submit a license appeal and recover the lost licenses.  Now, this functionality is built in to My Esri, empowering your organization with self-service functionality and enabling you to get back up and running quickly.

I wanted to make sure that our customers are aware of this great new functionality and walk through how you’d go about getting your licenses back in the event of a catastrophic failure or loss as described above – though I really hope that never happens.

To perform the following steps, you will either need “Esri Admin” permission or the “Take Licensing Actions” permission. Sensitive information such as machine IDs, license numbers, and other personal information have been replaced with asterisks in the following screenshots.

First, log in to My Esri and click the My Organizations tab.


Please note that I’m demonstrating the steps in a QA environment and that your experience won’t include the green QA…MyOrganizationTab.png

Click the Licensing tab.

LicensingOverview.png

This will bring up the Licensing Overview page and if you have the correct permissions, you should see the Recover Lost Licenses option both in the Licensing panel as well as a card.

Next, click Recover Lost Licenses.


The Recover Lost Licenses screen explains that this is a process to retrieve licenses from a machine that is no longer accessible due to system failure, system loss, or destruction. The License Recovery process requires the signature of the organization’s License Administrator in a Certificate of Destruction. This process is irreversible and should only be used as the absolute last option when all other solutions to rectify the problem have failed.

An example of when you would not use the Recover Lost Licenses option is if you can still access the machine and deauthorize the licenses normally. The instructions provided describe how to perform standard license deauthorization:
Once you’ve determined that it really isn’t feasible to scuba dive to the bottom of Lake Superior to recover your machine (and hence, its licenses), follow the steps outlined below to complete the recovery.

Step 1: Find Your Machine


To proceed with license recovery, select how you would like to find the machine. There is an option to search by products on the machine or use the machine’s UMN IDs if you know those.FindYourMachine.png

Step 2

Option A: Search for machine by product


Search for the machine by populating the dropdown boxes.SearchForMachine.png

Click Search.

We see that the search for ArcGIS Desktop Advanced Concurrent Use licenses for this organization returns five machines.SearchResults2.png

Selecting the machine from which the licenses need to be recovered will take you to Step 3.

Option B: Select Machine using the UMN

SelectMachine1.png

Enter the UMN for the machine and click Search.  Since the UMN by definition is associated with a single machine, you should get only one result in this case, as opposed to searching for a machine by product.SearchbyUMNresults1.png

Click Select to take you to Step 3.

Step 3: Review Selected Machine


This step will show you a list of products our records show were activated for the selected machine.ReviewSelectedMachine1.png

After reviewing the selected machine, you have the option to go back if this is not the correct machine or proceed with the license recovery process.

Step 4: Accept Terms and Conditions


Review and agree to the terms and conditions, and click Next.TermsAndConditions.png

Step 5: Summary to process License Return


This step gives you another opportunity to fully review the selected licenses to return. If the selection is correct, click the “Process Return” button near the bottom of the page.SummaryToProcessReturn1.png

You’ll receive a confirmation screen showing the status of each license return.ReturnedSuccessfully1.png

And that’s it.  You are now able to authorize these licenses on a new, dry machine!

In the event that not all licenses are returned successfully, you will be presented with a summary of which licenses were returned and which were not. These should be exceptions; not the norm. In these cases, please work with Esri Customer Service or your local distributor to finalize the recovery process.
Kory K. - Customer Advocacy Lead

more
5 10 20.3K
RebeccaRichman
Esri Contributor

Tips for figuring out what is going on when things aren’t working in ArcMap

Have ever you called Esri Support Services (ESS) with one question and the analyst asks you a seemingly unrelated question? Perhaps you are trying to open a DBF in ArcMap, and we want to know what version of Excel you use. Or perhaps you cannot access printing drivers and we ask you how much memory ArcMap is using. Sometimes the questions we ask can seem random, but they help us narrow down the root cause of the problematic behavior. Most processes in ArcMap involve multiple parts and file locations, so it can be difficult to determine what drives a specific behavior without taking a systematic approach to ruling out possible causes. To that end, this post provides a series of questions that will help you narrow down what may be causing problematic behaviors.

Do you Meet the Minimum System Requirements?

This is a simple question and hopefully one that was asked prior to installation, but it is always encouraged to check, particularly if you recently upgraded your software. A quick way to check if you meet the system requirements is to use the Can You Run It tool. If your system does not meet the requirements, you may need to upgrade your system.

Does ArcMap Open?

If ArcMap does not open, or crashes when opening a new, blank map document, this indicates that either something is wrong with the installation of ArcGIS Desktop or with the local customization of the program. In this case, here are a few troubleshooting steps:

  • Perform a soft reset (remove local customizations including folder connections and toolbar arrangement) by renaming the "C:\Users\<USERNAME>\AppData\Roaming\ESRI" folder as "Esri_old". When you reopen ArcMap, the folder is re-created.

Note: the AppData folder is a hidden folder, so you may need to unhide it.

  • Repair the software by navigating to Control Panel > Programs and Features > right click on ArcGIS Desktop > Uninstall/Change. Select the option to repair. Once the repair is finished, reboot the machine and test again.

Is the Issue MXD Specific?

When encountering a problematic behavior in ArcMap, a good place to start is to determine if the problem only occurs in a specific MXD. You can do this by opening a brand new MXD, dragging and dropping the data from the original MXD to the new one, and then trying to reproduce the issue. You can also copy and paste layout elements from one MXD to another. If the issue does not occur in the new MXD:

  1. Use the new MXD you created to test if everything is working correctly.
  2. If you have elements that cannot be easily copied and pasted from one MXD to another, use the MXD Doctor utility.
Stay tuned for an upcoming blog on MXD troubleshooting!

Is the Issue Workflow Specific?

Many users have multi-step processes in ArcMap as a part of their workflow; however, the more steps used, the more likely it is that an error can creep in. An error early on in a multi-step process can make it difficult to determine the root cause, as the issue can be introduced several steps before being observed.

Some steps that can assist in sorting out these workflow issues are:

  1. Write out the entire workflow from data acquisition to the step where the issue is seen.
  2. Teach the workflow to someone else. Often we only catch our mistakes when we have to explain what we did to another person.
  3. If you are using a script or model to perform a workflow, try the same workflow manually. If it works manually, break the script or model into parts and test each part individually.

Is the Issue Data Specific?

If the issue still occurs when you move the data to a new MXD, it is possible that the issue is data specific. To see if this is the case, test similar data that is stored in the same location, is in the same format, and contains similar features. For example, if you have trouble editing a shapefile containing points, edit a different point shapefile. If you do not have appropriate data to test with, you can also create a new shapefile, add some features to it, and test with that. If the issue only occurs with a specific dataset, then it is possible to take some basic data troubleshooting steps such as:

  1. Export the file to a different format (for example, export shapefile to feature class or GRID raster to TIFF).
  2. With vector data, try the Check Geometry and Repair Geometry tools.
  3. If the data does not draw in the correct location, check the projection. If the layer was created in one projection, and the projection was not correctly assigned to the data, it can draw in unexpected locations. For more information about figuring out what projection data was collected in, see here.

Is the Issue Location Specific?

Another potential cause of unexpected behavior is the location of the data. Location includes both the physical location (local machine drive versus server) and the workspace (geodatabase or folder). If the data is being accessed over a network, any issues or restrictions on the network may affect the way the data behaves in ArcMap. Likewise, any issues or permission limitations in the geodatabase can contribute to problematic behavior. If you suspect the issue is location specific:

  1. Move the data. If it is in an SQL database, move it to a file geodatabase or another SQL database. If it is on a network drive, move it to a local drive, then see if the issue persists.
  2. Ensure you have appropriate permissions for the location of your data.

Is the Issue Install Specific?

If the problematic behavior persists in all MXDs and with different datasets in different locations, there may be an issue with the installation. It is possible that either the installation file was corrupt or that the file was corrupted after installation. The troubleshooting steps in this case are the same as those for when ArcMap does not open at all. If you suspect the install file might have become corrupt during download, you can re-download the install file from My.Esri.com and reinstall.

Slide1-1024x576.jpg

A diagramatic view of the ArcGIS troubleshooting workflow

The Internet Is Your Friend (Mostly)

Most of the time, you aren't the first person to experience a particular issue and chances are, you can unearth some relevant findings on the internet. A good starting place is always ArcGIS documentation. If an issue is particularly common, it may be documented in Esri’s Knowledge Base, a collection of technical articles written by Esri staff. Larger issues, such as troubleshooting ArcMap performance or not being able to load Esri basemaps, may have been topics on the ArcGIS Blog or Support Services blog. Additionally, Esri hosts a very active user forum, GeoNet, where developers and other members of the Esri community can ask or answer posted questions. However, if you do find a suggested workflow, always remember that what works for someone else may not work for you. Therefore, it is highly encouraged to make copies of any MXDs or data, and proceed with caution.

Call ESS

The above steps do not address all possible issues, but they are effective and thorough starting points when trying to narrow down issues in ArcMap. If you still cannot narrow it down, give Esri Support a call! Our job is to assist you with these particular issues, and we always enjoy helping our customers resolve whatever issues they may be facing! When you do have to call, we kindly ask that you have the following information available so we can route you to the best analyst for the job and ensure that analyst has the information needed to begin troubleshooting with you!

  • Software version and license level
  • Operating system
  • Device, if using a mobile application
  • Synopsis of the issue
  • Detailed workflow
  • Error message
  • Test data

Note: You can contact ESS through phone, web chat, and web form. Start here.

We look forward to hearing from you!


Rebecca R. - Desktop Support Analyst

more
3 0 2,305
Andrew--Johnson
Esri Regular Contributor

icon3.png
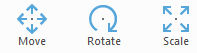
3D data is becoming more ubiquitous nowadays and is especially promoted throughout the ArcGIS Platform. From web scenes, to CityEngine, to ArcGIS Pro, there are many different applications to import, manage, model, and share your 3D data. To get the output you are looking for, it may require numerous steps and tools. To navigate some of these steps and tools, here are some tips and tricks for working with 3D data in ArcGIS.

3D File Coordinate Systems


The majority of 3D formats do not store a coordinate system. GeoVRML and KML are the lone exceptions. KML will use a WGS 1984 coordinate system and meters for the unit of measurement. All other types (DAE, 3DS, OBJ) must be placed properly, otherwise they may import at "0,0" (off the coast of Africa).Trick #1

If you are using CityEngine, you can drag and drop your shape from the Navigator window into the scene (this workflow assumes a scene coordinate system is already set). When you export the shape to a multipatch feature class, the coordinate system is created with the data so you can bring it into another ArcGIS product.Import OverviewTrick #2

The same workflow can be accomplished in ArcGIS Pro. Create an empty multipatch feature class, navigate to Editor > Create Features > Select Model, and click the globe to place the model.SelectModel-300x125.pngTrick #3Use the Replace with Model tool (ArcScene or ArcGlobe) or the Replace with Multipatch tool (ArcGIS Pro).replace.pngArcGIS Desktop Replace with ModelArcGIS Pro Replace with MultipatchTrick #4

If you are using ArcScene, ArcGlobe, or ArcGIS Pro, manually place the model during an edit session using the Move, Rotate, or Scale operations.Move, rotate, or scale a featuremove.pngNote: There is known issue with the Import 3D files tool. The placement points parameter is not honored so as of ArcGIS 10.4.1 or ArcGIS Pro 1.3, this tool is not a viable option. This issue is planned to be fixed in a future release.

Textures


To import your 3D file with textures, you must ensure the texture resides next to the 3D file, either as an individual image file or a folder with the images.Note: Both the file and folder must have same name for the software to recognize the texture.Trick #1

Textures are only supported in file or enterprise geodatabases. Shapefile multipatches do not support textures, so make sure to import the multipatch into a geodatabase.

Z-values


Make sure your 3D data has valid z-values. When sharing a web scene or importing the data into ArcGIS Pro, you want to make sure the elevation values are correct.Trick #1

If your multipatch is not at the correct elevation, you can use this trick. In ArcGIS Pro,Elevation-300x190.png
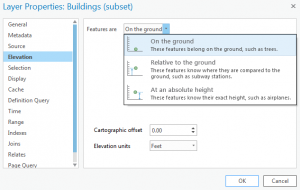
set the multipatch data "on the ground" and use the Layer 3D To Feature Class tool. The elevation values are then embedded into the multipatch.Trick #2

If you are using simple feature data (non-multipatch), use the Add Surface Information tool to add z-values to the data. Also, you can add z-values to an attribute table and with the Add Z Information tool, you can verify the values with the tool's output. If the data does not have valid elevation values, see the next tip.

Tools to Create 3D Data


Understand which tools can create 3D data: Layer 3D To Feature Class, Interpolate Shape, or Feature To 3D By Attribute.

Understanding 3D Data


Understand your 3D data. Extruded 2D polygons are not true 3D features, so you must export to multipatch to make the polygon a true 3D feature. Simple point, line, and polygon features can be considered 3D data if they have the correct z-values. 2D features can also be symbolized using 3D marker symbology.

Know the difference between a z-enabled feature class and a non-z-enabled feature class with a z field in the attribute table. Feature classes must be z-enabled to display at the correct elevation. You might see a z field in the attribute table, but that does not mean the geometry has the correct z-values. This can be verified by editing the vertices or adding z-values to an attribute table, as described above.

While this blog does not cover every facet of working with 3D data, it is my hope that this will provide some valuable information for working with 3D data on the ArcGIS Platform.
Andrew J. – Desktop Support Analyst

more
2 0 3,205
38 Subscribers