Esri Technical Support Blog

cancel
Showing results for 
Show  only  | Search instead for 
Did you mean: 

Other Boards in This Place

Latest Activity

(383 Posts)
Jacqui_Newell
Esri Contributor

The new Technical Support web experience is now live and ready for you to explore. It’s designed with your needs in mind to help you access the ArcGIS help you need quickly. 

Read more...

more
4 7 986
Jacqui_Newell
Esri Contributor

Soon, ArcGIS users will have a new Technical Support experience featuring a new look and helpful new ways to access information. 

Read more...

more
2 0 726
MeganSingleton
Occasional Contributor III

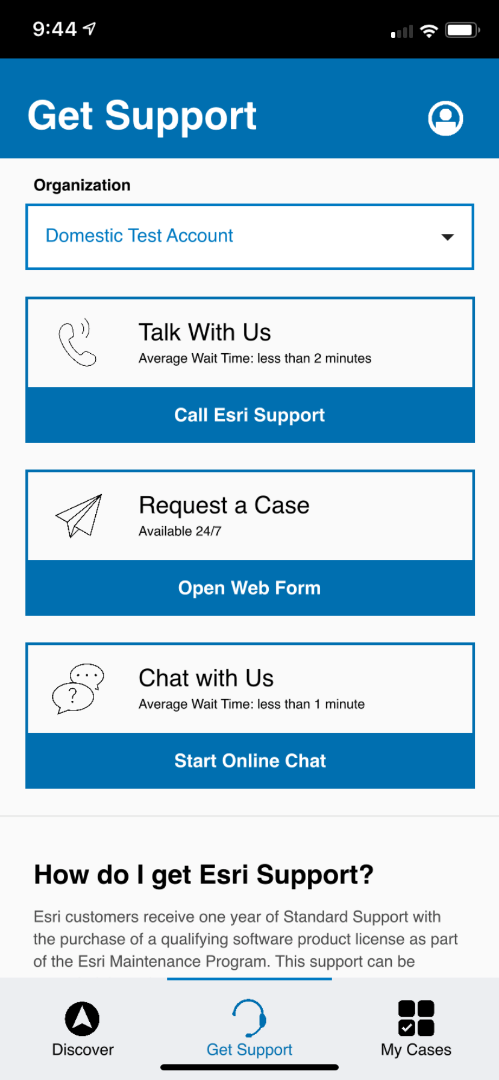
Esri Support Mobile App Logo

The Esri Support Mobile App

Find answers and get expert help for your geospatial solutions

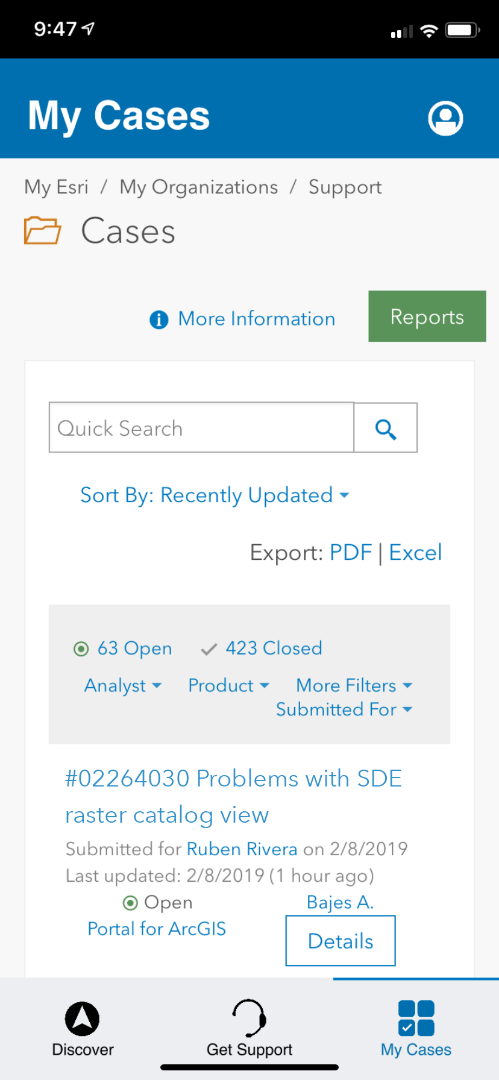
The upcoming Esri Support mobile app provides a tailored support experience that makes getting help for your ArcGIS Platform convenient.

Quick access to Esri Support Convenient case managementFind answers on your own

We're excited to release the app and are preparing for launch. If you'd like early access to the app or wish to influence the trajectory of your mobile support experience with Esri, please join us in beta testing the Esri Support app. 

To learn more about the app and request access to the closed beta testing program, please visit the app page on the Esri Support website.*

Learn More & Navigate to the Closed Beta Download


We’ll release the full mobile app once beta testing is complete—stay tuned. 


Cheers,

The Esri Online Support Team

*For now, the closed beta version of the app is available for U.S. customers and international distributors. 

more
3 0 1,898
MeganSingleton
Occasional Contributor III

When looking for answers and solutions related to the ArcGIS Platform, you may have used Support.Esri.Com in the past. This site hosts the largest search collections on the Esri.com and ArcGIS.com domains, returning content from the Support knowledge base, ArcGIS product documentation, the GeoNet community, Wiki.GIS.com, and other helpful repositories. 

To refine your experience when you're looking for answers, Esri recently updated the search experience on Support.Esri.Com by adding a new search engine and search features.

Search Features

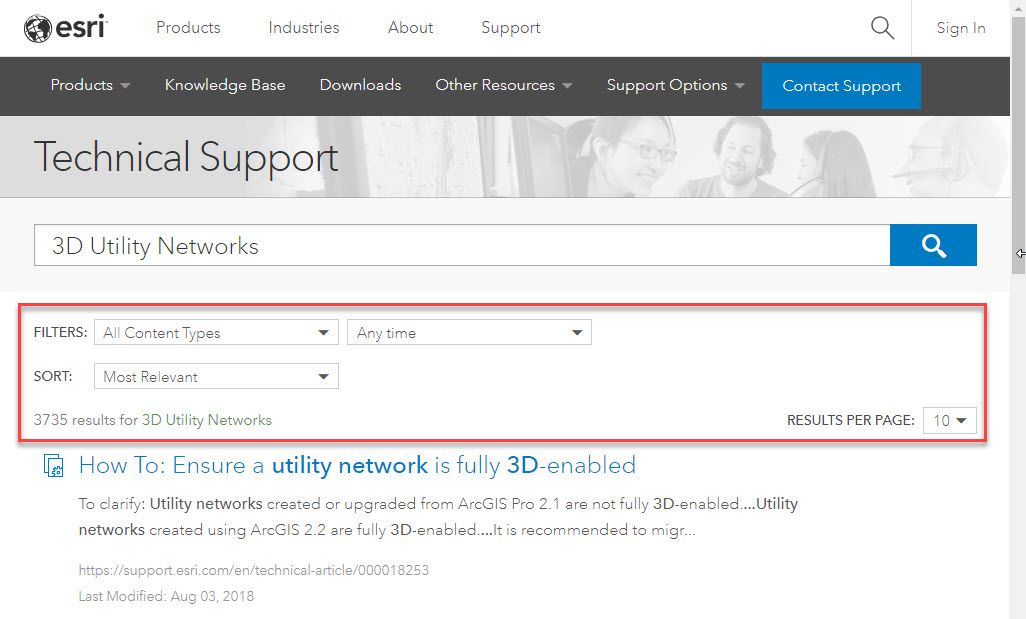
The Support.Esri.com search page includes two filters, chronological sorting, the total number of results, and an option to select the number of results displayed per page.

Support.Esri.Com New Search Features

Content Type Filter

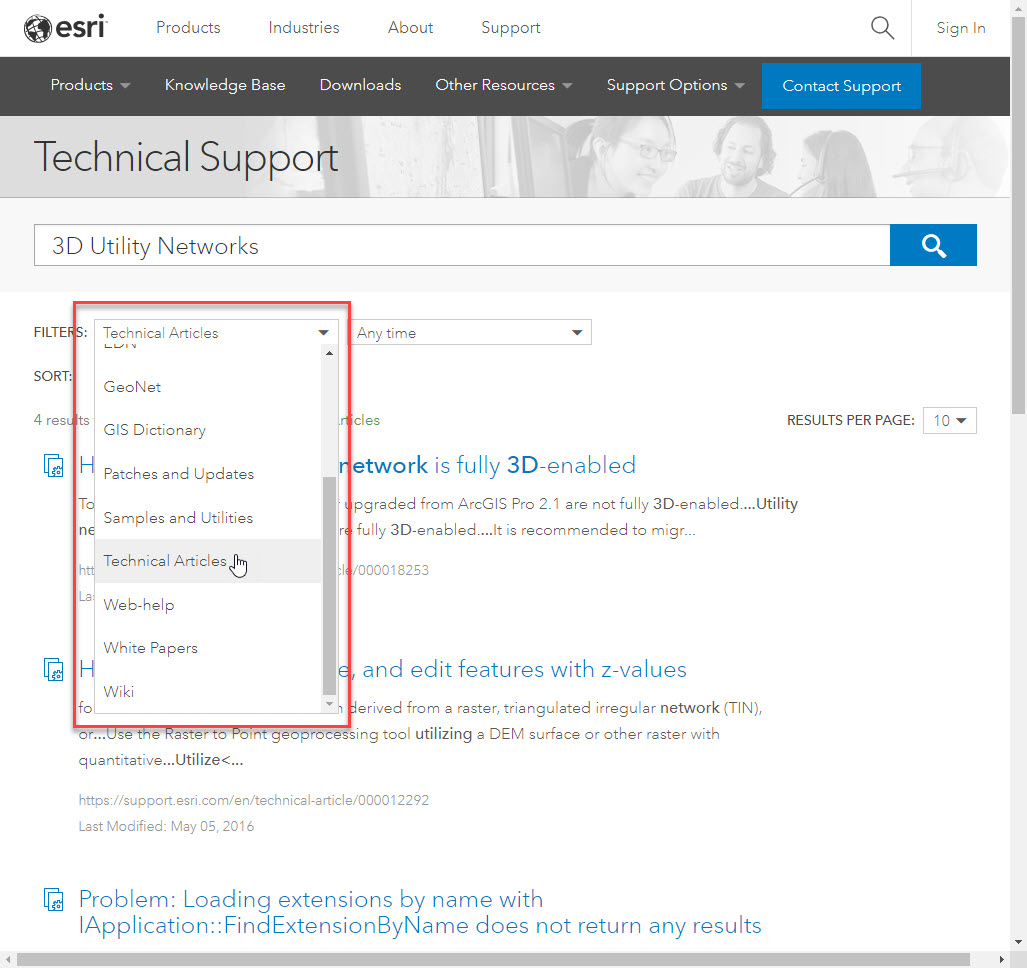
The Content Type filter enables you to select a specific repository for your search results. For example, if you select Technical Articles, only results from the technical article knowledge base return.   


Content Type Filter on Support.Esri.Com

Time Filter 

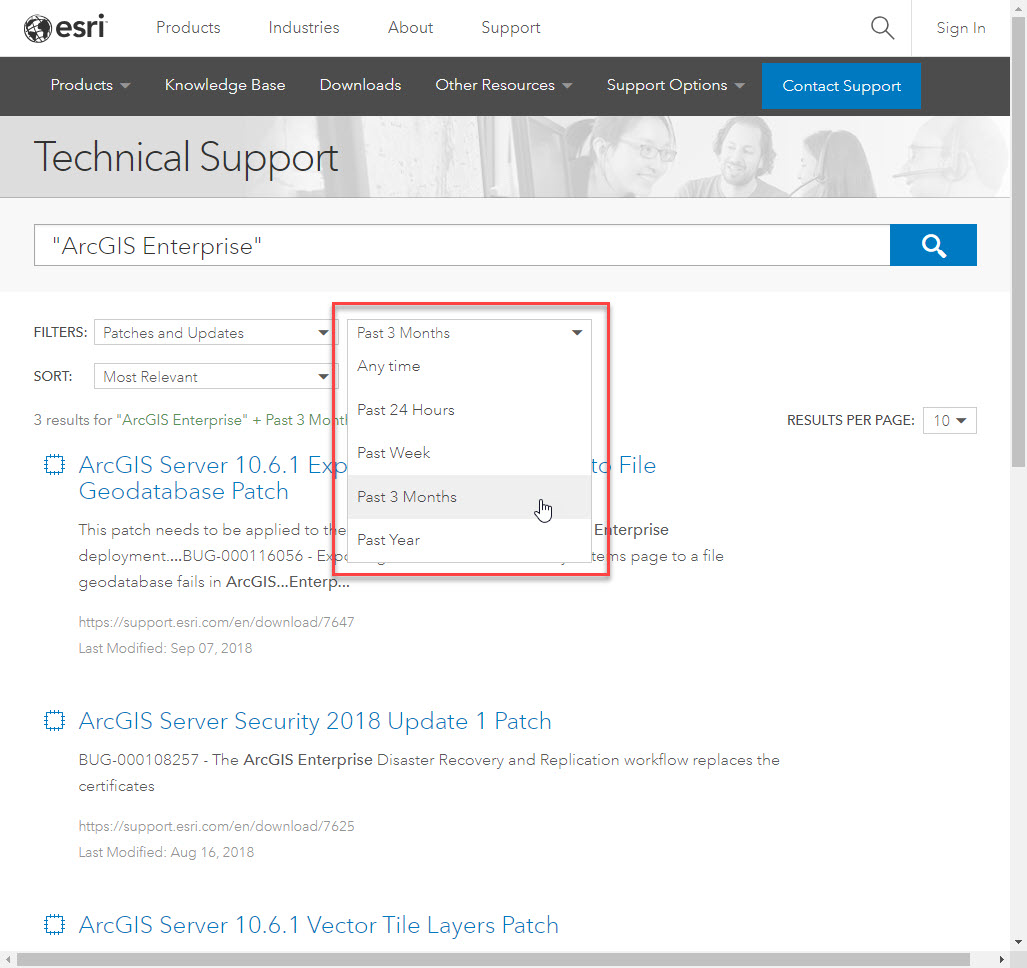
The Time filter narrows your search results down to a recent time frame, ranging from the past 24 hours to the past year. For example, if you select Past 3 Months, only content published or modified in the last three months returns. In the image below, the results are filtered to only display Patches and Updates content published in the Past 3 Months.


Time Filter on Support.Esri.Com

Chronological Sort

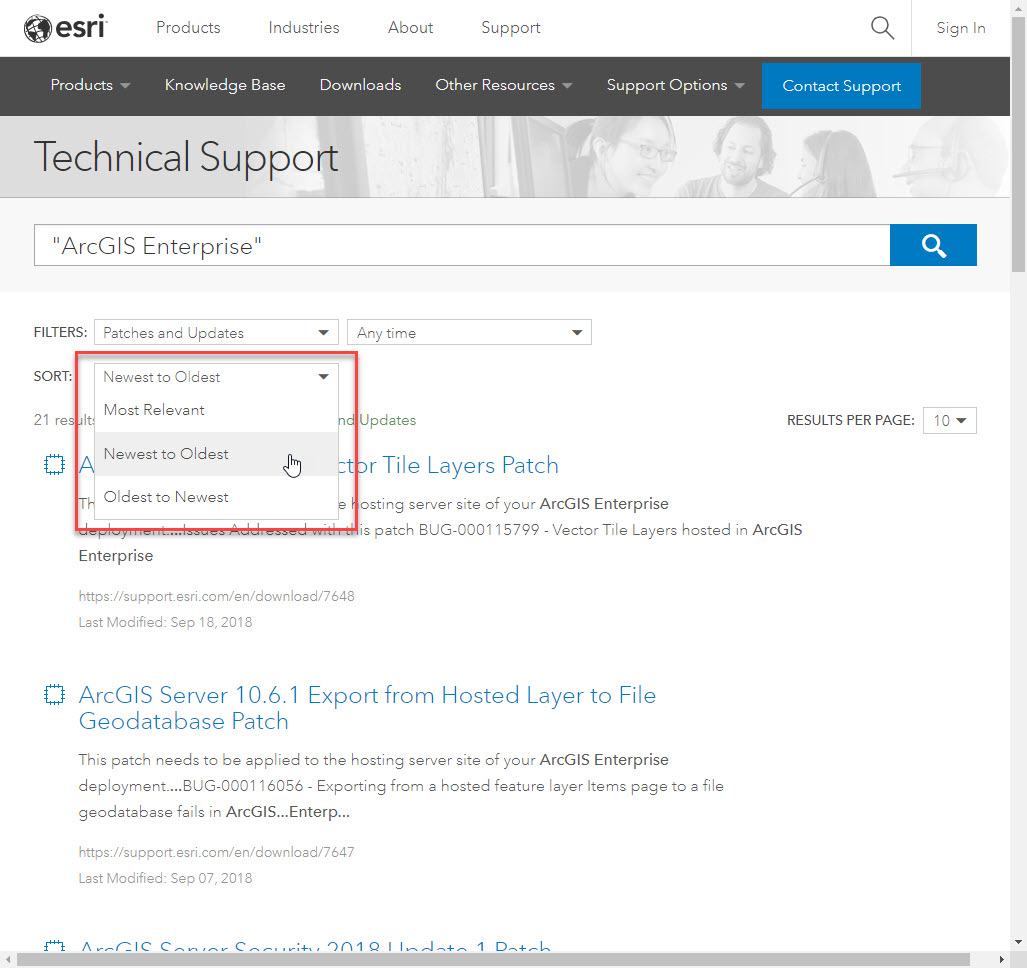
The Chronological sort orders search results by publish date. By default, search results are displayed in order of relevancy, but this feature can re-order the results by Newest to Oldest or Oldest to Newest within the selected time filter. For example, if you filter by Patches and Updates and sort by Newest to Oldest, the most recent content displays at the top.

Chronological Sort Feature on Support.Esri.Com


Total Number of Search Results 

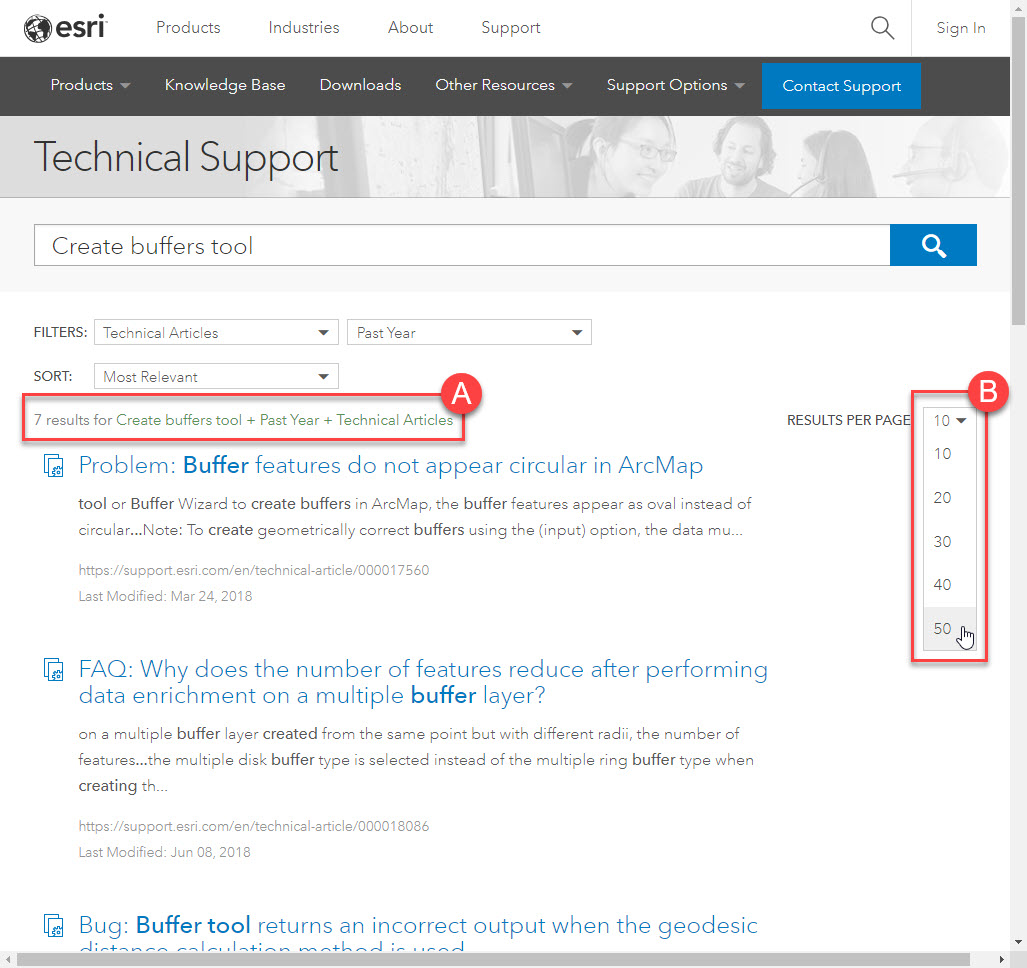
The total number of search results for the search query and applied filters displays under the filters and sort drop-down options. The new search engine limits the total number of results returned to 10,000 results. If a search query returns 10,000 results and the expected page is not included, please refine the search query or apply content and time filters.

Pro Tip: You can search for exact phrases by adding double quotes around the search text (for example, “Create buffers tool”). Searching with double quotes only works if all text is inside double quotes; if there is text outside of the double quotes, the quotes are ignored.

Results Per Page Selector

The Results Per Page selector displays up to 50 results on each page. For example, if you select 50 results per page, 50 results display instead of the default of 10 results.  

Total Number of Search Results Feature on Support.Esri.Com

What to Expect

Search results will be different with the new search engine. Search engines typically improve over time as the results are fine-tuned and we generate more content for better relevancy. For the localized Support websites, both English and translated content is returned in search results. If needed, you can also search with Google or Bing, which are not impacted by the updates.

How to Help Improve Search

We understand that content discoverability through search is an important part of the  support experience. If the new search does not return the results you expect, please submit your feedback via the feedback web form in the footer of the Support website or email us at support_feedback@esri.com.

Happy searching,

The Esri  Support Resources Team 

more
3 0 3,954
by Anonymous User
Not applicable

Picture the scenario: You are working with Collector for ArcGIS, but you continue experiencing minor problems with adding points. You give your friendly Esri Support Analyst a call and they begin walking you through some steps to troubleshoot the app. You’re not seeing the options they’re talking about, and it’s getting a little frustrating. If only there was a way to show the Esri Analyst your screen so things could go more smoothly….Well there is! It is possible to share the screen on your iOS and Android devices using Zoom.

Please be aware that iOS 11 or later is required to perform screensharing with Zoom


To screenshare from a Mobile Device with Zoom....

1. Install the Zoom app from the Google or Apple Store on the mobile device

2. Launch the Zoom app > Ignore Sign In/Sign Up and click on "Join a Meeting"

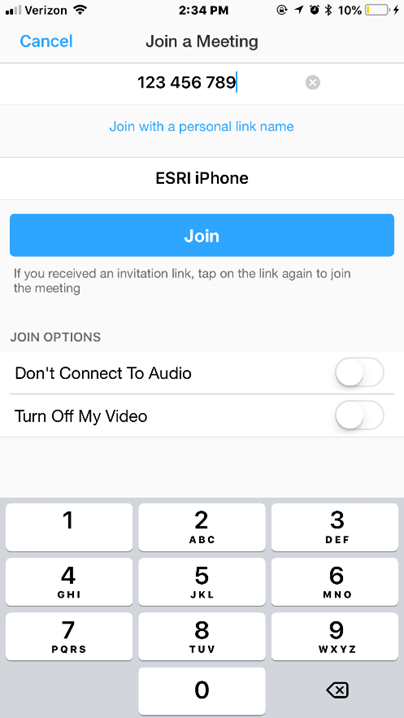
3. You will be prompted for the meeting ID, just as you would on a desktop. Enter the meeting ID provided by the analyst

4. Once you have joined the meeting, things are a little different for beginning the share between Android and iOS

Android:
5a. Tap the black screen once and you will see a toolbar come up from the bottom. Click "Share Content." Click "Allow" if prompted to give the device permissions to share. You are now sharing on an Android device.

iOS (>11 only):

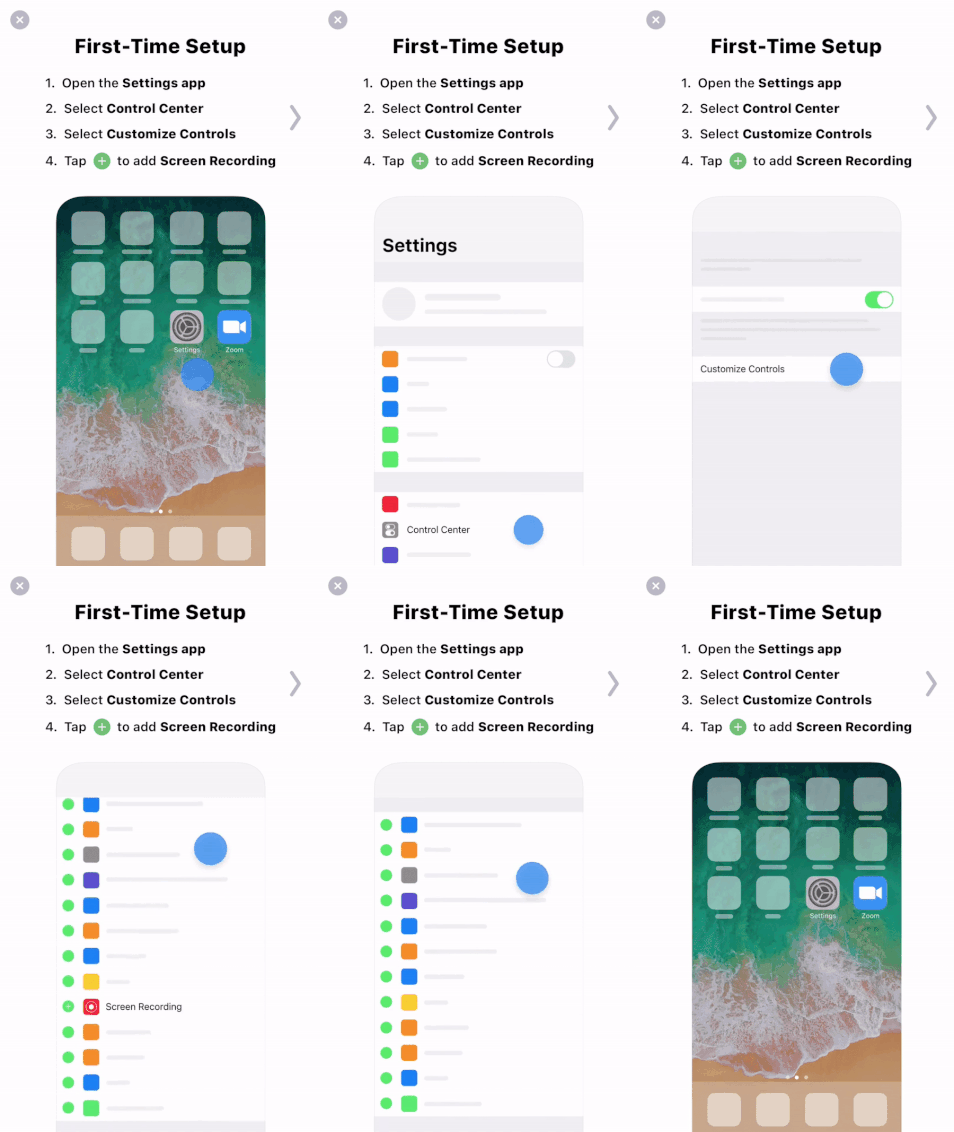
5b. Add Screen Recording to the Control Center 
> Settings > Control Center > Customize Controls > Add Screen Recording

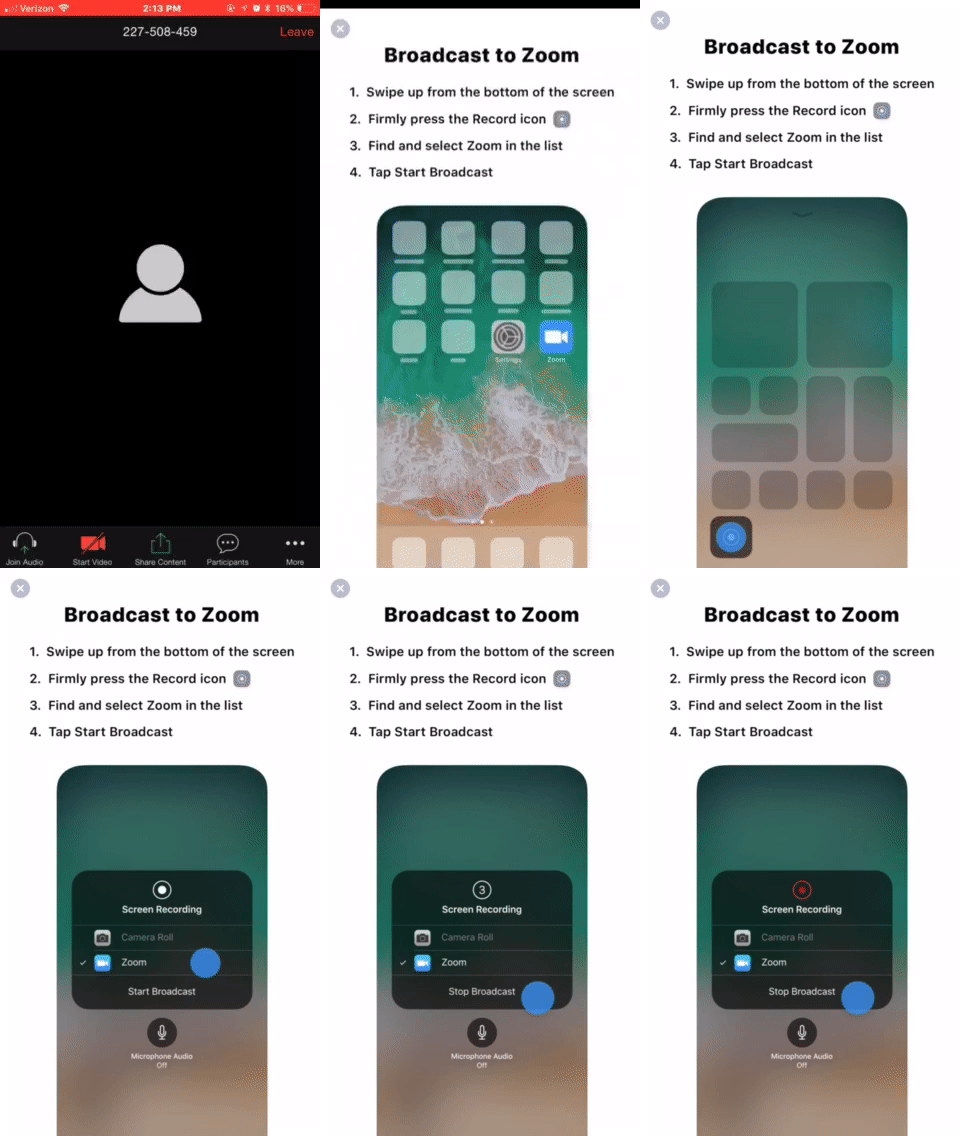
6. Once Screen Recording is added, swipe up from the bottom of the screen to display the Control Center

7. Tap and HOLD the Screen Record button > A dialogue will pop up to have you switch Screen Recording from Camera Roll to Zoom

8. Start Broadcasting > 3,2,1 countdown will begin and the screenshare will begin after 1.


If you would like to get in contact with an Esri Support Analyst, please call 1 (888) 377-4575 and choose option 2. You can also visit our website to request a case or begin a live chat: https://support.esri.com/en/contact-tech-support

Happy Screensharing!

more
11 3 13K
MunachisoOgbuchiekwe
New Contributor III

Introduction

This is a quick blog post to show how easy it is to integrate beautiful graphs into your JavaScript application using the 4.x API. If you are new to the ArcGIS API for JavaScript, we provide an easy way to get started making web mapping applications. Head over to the ArcGIS API for JavaScript site to get started. For this sample we will be using a third party library called Chart.js. Chart.js is a simple yet flexible JavaScript charting library which makes it easy to make simple graphs for your data.

Load in the Chart.js library into your JavaScript application

In order to use Chart.js in our application we need to load it in as a module. This is because Dojo uses Asynchronous Module Definition (AMD) format to load in modules as supposed to loading in a file using a script tag. To achieve this we can use dojoConfig to load in our custom JS package as a module.

<script>
        const options = {
            // tell Dojo where to load other packages
            dojoConfig: {
                async: true,
            packages: [
                {
                    location: 'https://cdnjs.cloudflare.com/ajax/libs/Chart.js/2.7.2/Chart.js',
                    name: 'Chart'
                }
            ]
            }
        };
</script>
<script src="https://js.arcgis.com/4.7/"></script>‍‍‍‍‍‍‍‍‍‍‍‍‍‍‍‍‍‍‍‍‍‍‍‍‍‍‍‍‍‍

As you can see from the sample code above, we are going to tell dojo to load in a module from a Content Delivery Network (CDN). In this case we are using the CDN that Chart.js provides for us. You can also install the files through a package manager like npm or Bower. You can learn the different ways of installing Chart.js through their Installation documentation. To avoid any potential errors, ensure the dojoConfig is declared before the ArcGIS for JavaScript API.

Integrating Chart.js in your JavaScript application

Once you have completed the above steps, we can now use Chart.js in our JavaScript file...

require([
    "esri/Map",
    "esri/views/MapView",
    "esri/PopupTemplate",
    "esri/layers/FeatureLayer",
    "esri/widgets/Popup",
    "esri/tasks/support/Query",
    "https://cdnjs.cloudflare.com/ajax/libs/Chart.js/2.7.2/Chart.js",
    "dojo/domReady!"
  ],
  function (Map, MapView, PopupTemplate, FeatureLayer, Popup, Query, Chart)‍‍‍‍‍‍‍‍‍‍‍‍‍‍‍‍‍‍‍‍‍‍

In the require array we put in the CDN link to the library. We then name the module Chart so that we can create a new instance of it later on in our code.

Querying data from a Feature Layer

In this example I am using a Feature Layer of California from ArcGIS online . Each time I click on a county, I want a pop up to show information about the demographics of the area. For this we can use a Query, which will allow us to get information from our Feature Layer and spatially query the layer to only show data where we clicked. Once the promise has resolved, we will call the view's PopUp and send the data to setContentInfo. This is a function that will create the chart for us. The setContentInfo function will be explained more in detail on the next section. Here is the code snippet that shows this.

   var query = new Query();

    query.returnGeometry = true;
    query.outFields = ["STATE_NAME", "WHITE", "BLACK", "ASIAN", "HAWN_PI", "OTHER", "HISPANIC"];
    query.where = "1=1";
    query.num = 50;

    // On view click, query the feature layer and pass the results to setContentInfo function.
    view.on("click", (e) => {
      query.geometry = e.mapPoint;
      featureLayer.queryFeatures(query).then((results) =>{
        if(results.features[0].attributes.STATE_NAME === "California"){
          view.popup.visible = true;
          view.popup.open({
              title: "Doughnut Graph Example",
              content: setContentInfo(results.features[0].attributes)
          });
        }
      });
    });‍‍‍‍‍‍‍‍‍‍‍‍‍‍‍‍‍‍‍‍‍‍‍‍‍‍‍‍‍‍‍‍‍‍‍‍‍‍‍‍

Create a graph using Chart.js

We now get to include the Chart module that we instantiated awhile ago. In the previous code we set the content parameter to a function called setContentInfo and passed in the data. In the next code snippet, we are going to create this function and use it to initialize our charts inside the pop up. To start off we are going to create a new canvas element and give it the id of myChart.

var canvas = document.createElement('canvas');
canvas.id = "myChart";‍‍‍‍

Then we are going to set up the Data Structure object with our own data. In this particular case we are using a doughnut graph which would have a different Data Structure than a line graph. For more information about the different types of charts you can use, please see the following documentation on the Chart.js website. For a doughnut graph the object would look like the following code snippet below.

var data = {
      datasets:[{
        data: [results.ASIAN, results.BLACK, results.HAWN_PI, results.HISPANIC, 
                 results.OTHER, results.WHITE],
        backgroundColor: ["#4286f4", "#41f4be", "#8b41f4", "#e241f4", "#f44185", "#f4cd41"]
      }],
      labels: [
        'Asian',
        'Black',
        'Hawaiian',
        'Hispanic',
        'Other',
        'White'
      ]
    };‍‍‍‍‍‍‍‍‍‍‍‍‍‍‍‍‍‍‍‍‍‍‍‍‍‍‍‍‍‍

You can see that in the data array, we are setting the results that we got from our feature layer. Each result will represent one piece of the doughnut graph, the backgroundColor is also set for each result value. Additionally, the labels attribute is set for each item in the data array.

Finally, our last step is to create a new Chart object with the data and type properties. Then we return the Chart object.

var myPieChart = new Chart(canvas,{
      type: 'doughnut',
      data: data
  });
return canvas;‍‍‍‍‍‍‍‍‍‍

Once the object is return we should get a chart inside our pop up showing demographic information each time we click on a county. You can also create this sample using TypeScript. Here is a link to the sample, if you are wondering how it would look in TypeScript.

Tip: Here is a quick video showing how the sample works.

Conclusion

The ArcGIS API for JavaScript makes it super simple to integrate beautiful graphs from third party libraries like Chart.js. There are many more libraries that you can integrate into your JavaScript application like this that allows you to make powerful maps with additional functionality. Feel free to head over to the GitHub Gist page for the full sample.

more
5 3 5,763
JuliePowell
Esri Contributor

This post provides insight into how we manage version 3.x of the ArcGIS API for JavaScript (JSAPI) release plan and technical support strategy.


The JavaScript development team has made great progress bringing version 4.x of the JSAPI closer to parity with 3.x, meanwhile introducing new tech for building very dynamic, expressive 2D and 3D apps. Over the next year, each release will be a balance between capabilities for reaching full parity with 3.x and brand-new innovation. Many customers’ app requirements are fully met by the current release of the 4.x API (4.7) while others are still dependent on 3.x (either with existing apps that they are maintaining or new apps that have requirements such as full editing support). We also have many Esri apps built on 3.x, such as the 2D version of Web AppBuilder for ArcGIS.


Technical Support Plan

Because we have a large customer base that still depends on 3.x, we are very careful about how we manage the Product Life Cycle (PLC). Our strategy is to make all PLC dates relative to our estimation of the last 3.x release. When is the last release? It depends on when we reach full parity in 4.x, enabling us to move critical apps such as ArcGIS Online’s map viewer to 4.x. When we reassess our estimation of the final release date, PLC phase dates are updated accordingly.


Relative dates for each PLC phase are determined in the following manner:

- 3.x remains in "General Availability" until the last release of 3.x.

- 3.x moves into "Mature Support" after the last release, and lasts for 1 year. 

- 3.x is retired 3 years after General Availability ends. 

For more information about the above software support phases and what they entail, refer to the PLC.


Recent Update to the PLC

Version 3.x was scheduled to move into mature phase next month; July 2018. Based on the current status of the API, this was moved to July 2019, with the mature phase starting August 2019 and retirement in August 2022. As mentioned above, these dates will be revisited depending on progress made towards 3.x parity.


If you need further clarification on the above, please reach out to Technical Support through the normal channels.

 ArcGIS API for JavaScriptKwasi Asante‌ 

more
6 4 4,891
MeganSingleton
Occasional Contributor III

Parlez-vous français? The award-winning Esri Support website is now available in French!

Note: To view Support.Esri.Com in a language other than your default language, navigate to the language selector in the footer on any Esri.com page and select the desired language.

The Esri Support website hosts many critical resources for the Esri community, such as popular technical articles, product lifecycle documentation, support downloads, and more. The launch of the site in the French language represents our commitment to making these resources readily available for ArcGIS users around the globe. 

The French version of Support.Esri.com joins the Chinese, German, Japanese, and Spanish versions of the website, and will be joined in the upcoming months by additional languages.

Stay tuned!

Merci,

The Esri Online Support Team

more
2 3 10.5K
tempJosephMayfield
New Contributor III

Sprechen SIe Deutsch? The award-winning Esri Support website is now available in German! 

The Esri Support website hosts many critical resources for the Esri community, such as popular technical articles, product lifecycle documentation, support downloads, and more. The launch of the site in the German language represents our commitment to making these resources readily available for ArcGIS users around the globe. 


The German version of Support.Esri.com joins the Chinese, Japanese, and Spanish versions of the website, and will be joined in the upcoming months by additional languages.


Note: To view Support.Esri.Com in a language other than your default language, navigate to the language selector in the footer on any Esri.com page and select the desired language.

more
3 0 679
chailasikasula
New Contributor

Hi I created Apps for different sites situated in different locations  using Portal for Arcgis .All the Apps seem to be working just fine apart from 1 site were I m getting complaints that some published tile  layers are not visible even when turned on in layers tool. 

What could be causing this problem? I asked that the proxy parameters be added to the LAN settings but I m told the problem still persists.

Please help

more
0 0 652
39 Subscribers