Implementing ArcGIS Blog

cancel
Showing results for 
Show  only  | Search instead for 
Did you mean: 

Other Boards in This Place

Latest Activity

(176 Posts)
AaronLopez
Esri Contributor

Measured transaction throughput and response times are critical data of any ArcGIS Enterprise load test, but captured hardware utilization of the deployment machines provide vital information as well. Together, these test artifacts allow for the proper analysis of the capabilities and efficiencies of the Site.

Determining that an application or feature service has achieved a particular level of throughput is good, but confirming the scalability characteristics while also examining the captured processor utilization of the tested workload is even better.

This Article will discuss several ways to capture the machine hardware utilization. This resource usage is a great compliment to the results of an Apache JMeter load test of ArcGIS Enterprise and can help further the analysis. The Article will focus on the most common scenarios using free tools and utilities for Windows and Linux.

Table Of Contents

  • Capturing Hardware Utilization During an Apache JMeter Load Test
  • Capturing Strategies
    • What Information Should the Load Test Capture?
    • Sample Interval
    • The Difference Between Capturing and Monitoring
    • Test Clients (Load Generator Machines)
    • Understand Your Server Baselines
    • Common Utilization Capturing Examples
      • Using Perfmon (To Capture Utilization Outside of Load Test)
      • Using dstat (To Capture Utilization Outside of Load Test)
      • Using Apache JMeter (To Capture Utilization Directly From Load Test)
  • The SampleWorldCities Test Plan With Metric Collection Support 
    • Components of the Test Plan
      • jp@gc - PerfMon Metrics Collector Extension
    • Validate the JMeter-to-ServerAgent Connectivity
  • Test Execution
  • General Methodology Guide
  • Common Utilization Collection Challenges
  • Final Thoughts


Read more...

more
0 0 719
AaronLopez
Esri Contributor

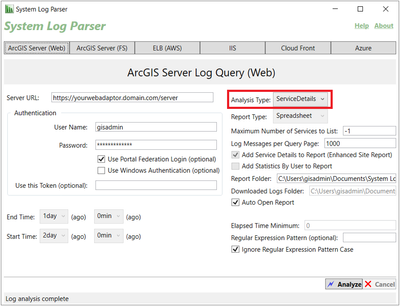
Looking for a quick way to summarize the details of all your ArcGIS Enterprise services? If so, then System Log Parser's ServiceDetails Analysis Type is highly recommended. This feature performs a scan of your Site through the REST Admin API and presents the gathered information into a spreadsheet report for easy digestion.

The report is a great resource to find details on your service provider statistics, service configuration info, or data source analysis.

systemlogparser_gui_servicedetails.png


Read more...

more
2 0 633
AaronLopez
Esri Contributor

The System Log Parser (SLP) utility is great for being able to analyze many different "ArcGIS Enterprise" log sources to help quantify the usage of your Site. It is free and includes an easy-to-use graphical user interface (GUI) called SystemLogsGUI.exe. But, did you know it can also be run from the command line via the slp.exe that is included with the download?
Command line capable execution makes a good fit for automation through PowerShell or good old fashioned bat scripts.

The slp.exe executable includes all of the same capabilities. However, you can override many of the limits imposed by the GUI such as: the end time and start time. You can even access features that are not available from the GUI like: searching with specific UTC dates, customizing the name of the report, and enabling the application debug log (for troubleshooting).

Read more...

more
6 3 1,078
AaronLopez
Esri Contributor

Although you are probably familiar with using System Log Parser (SLP) to read logs and help you quantify your ArcGIS Enterprise usage, there is a relatively new feature in this popular, free utility that can make the effort easier and the analysis more powerful. 

The new feature, commonly referred to as the Optimized report in System Log Parser, allows you perform log queries of much larger time spans. In addition, it can perform the parsing faster and with tremendous memory savings over the classic analysis types (e.g. Simple, WithOverviewCharts and Complete).

The Optimized option still generates a spreadsheet-based report statistically summarizing the collected log information into key time focused categories. 

Read more...

more
3 1 1,529
NoahMayer
Esri Contributor

The Architecture Practice team in Professional Services have been writing articles to assist the community to plan, design and deploy ArcGIS Enterprise. This purpose of this page is to be a single resource to all these blogs and will be updated as new posts are created.

Read more...

more
11 1 1,875
DannyKrouk
Esri Contributor

GIS Enterprise Reporter allows you to clearly document existing deployments of ArcGIS Enterprise (Portal for ArcGIS, federated ArcGIS Server Sites, ArcGIS Data Stores, etc.).  You can use this tool to document and compare deployments in different environments, understand changes over time, etc.

Please note that this tool is not a product of Esri.  It is a tool produced by an employee of Esri and made broadly available in the hopes that it will be useful.  It is provided "as is".


Read more...

more
31 0 7,424
AaronLopez
Esri Contributor

Apache JMeter is a great load testing tool, but it's a fantastic automation framework too! This Article focuses on using JMeter to call the ArcGIS REST API in order to carry out user management tasks that would be tedious for large numbers of members. 

Table Of Contents

  • Administration Automation with Apache JMeter
  • The User Administration Test Plans
    • The CSV Data Set Config of Users
    • The Text File List of Users
    • Administrator Login
  • Add a New User (portal_users_add1)
  • Add a New User (portal_users_add2)
  • Add a New User (portal_users_add3)
  • Set the Security Question/Answer for New Users (portal_users_update_profile1)
  • Disable a User (portal_users_disable1)
  • Enable a User (portal_users_enable1)
  • The Thread Group Configuration
  • Test Execution
  • Validating the Test Plans
    • Troubleshooting a Command-line Test Execution
  • Final Thoughts
    • A Quick Word on Using Multiple Threads 
    • A Quick Word on Deleting Users


Read more...

more
0 0 626
AaronLopez
Esri Contributor

A geoprocessing (GP) services is essentially a resource that is setup to perform or automate any ArcGIS Enterprise task. The purpose of this tool could be something that works on a feature class or table and creates an output dataset. The work performed could be to take in a set of inputs and generate a buffer or project to another spatial reference.

They take the form of being either synchronous or asynchronous. This is known as the execution mode.
Synchronous geoprocessing services are ideal for small jobs where the required computation to complete the task is very quick (e.g. just a few seconds). In this case, all the requests involved in the process are short-lived and load testing such a service would be straight-forward: construct a test to send the requests as they (sequentially) appear when interacting with the service. Once the job request is submitted, the response returns as soon as it has completed.

Asynchronous geoprocessing services on the other hand, have more moving parts. Since the task could be very long running, once the job has been submitted, its up to the user (the tester) to periodically check on the status of job with a separate request. Status state checking logic inside a loop introduces complexity to the test.

This article can be used as a guide for load testing an Asynchronous GP service. While it is specific to the "Summarizing Invasive Species" example, the majority of the test and its logic can be applied to other geoprocessing services.

Table Of Contents

  • Why Test a Asynchronous Geoprocessing Service?
  • Asynchronous Geoprocessing Service Testing Challenges 
  • How to Test an Asynchronous Geoprocessing Service?
    • The "Summarize Invasive Species" Geoprocessing Model and Dataset
    • Test Data Generation
  • The Asynchronous Geoprocessing Service Test Plan
    • Components of the Test Plan
      • SubmitJob
      • CSV Data Set Config
      • InitialJobStatus
      • LoopJobStatus
      • WhileLoop
        • JobStatusCheck
        • ResponseAssertion
        • SleepWhileLoop
        • IfWhileLoopMax
      • IfJobSucceeded
      • DownloadOutput
      • IfTestIterationMax
  • The Thread Group Configuration
  • Validating the Test Plan
    • Transactions
    • Requests
  • Test Execution
  • JMeter Report
    • Throughput Curves
    • Performance Curves
  • Final Thoughts
    • A Quick Word on Sizing
    • A Quick Word on Instances
    • A Quick Word on the Location of the arcgisjobs Folder


Read more...

more
0 3 1,254
AaronLopez
Esri Contributor

Cached map services are a popular and recommended way to provide a fast performing presentation of static data. When map services are cached, the server draws the data at a set of map scale levels you define and saves the images. Then, as the server received requests for the map, it is much quicker (and requires less CPU resources) to retrieve the pre-created cached images than it is to dynamically draw the map again. This is the benefit of cached map services.

Generally speaking, cached map services can support simultaneous requests from many users. Such services can scale well. Despite this well known performance characteristic, it is still a common requirement to load test a cached map service to see first-hand how it behaves and scales on the hardware of a particular ArcGIS Enterprise deployment.

This Article contains a walk-through for load testing a cached map service with an Apache JMeter Test Plan. The examples use a public accessible dataset. Using datasets in Coordinate Systems other than WGS 1984 Web Mercator Auxiliary_Sphere (WKID: 3857) should work, but the generated test data will be based on a WKID of 3857.

Table Of Contents

  • Why Test a Cached Map Service?
  • Cached Map Service Testing Challenges
  • How to Test a Cached Map Service?
    • The Natural Earth Dataset
    • Test Data Generation
      • The Generate Bounding Boxes (Precision) Tool
      • Visualizing the Generated Data in ArcGIS Pro
      • Visualizing the Generated Data in a Text Editor
  • The Cached Map Service Test Plan
    • Components of the Test Plan
      • CSV Data Set Config
      • Levels Of Detail List Logic
      • GetMapTile Logic
      • Cache Tile Loop and Path Population
        • Loop Controller
        • Counter
        • JSR223 Sampler
        • HTTP Request
  • The Thread Group Configuration
  • Validating the Test Plan
    • Transactions
    • Requests
  • Test Execution
  • JMeter Report
    • Throughput Curve
    • Performance Curve
  • Final Thoughts
    • Additional Items Worth Mentioning
    • Assumptions and Constraints
Read more...

more
2 4 1,126
AaronLopez
Esri Contributor

Network Analyst has always been in-demand capability of ArcGIS Enterprise as it provides popular problem solving analysis types such as Route, Service Area, Closest Facility and Origin-Destination Cost Matrix.

This Article contains a walk-through for load testing a route solver service (map-based service) with an Apache JMeter Test Plan. It uses a public accessible dataset in the examples for the data generation and test configuration process. However, the testing procedure should work when using any valid network dataset. This Article assumes you are familiar with Apache JMeter and some of the Test Plan strategies we have been using in other discussions.


Table Of Contents

  • Network Analyst Route
  • Load Testing a Network Analyst Route Service
  • How to Test a Network Analyst Route Service?
    • Network Analyst ArcGIS Pro Tutorial Data
    • Test Data Generation
      • Making the Tools Available from ArcGIS Pro
      • Launch the Generate Data (Solve Route) Tool
      • The Generate Data (Solve Route) Tool Inputs
      • Spatially Visualize the Generated Points
  • The Route Solver Test Plan
    • HTTP Request
    • The Thread Group Configuration
  • Validating the Test Plan
    • Transactions
    • Requests
  • Test Execution
  • JMeter Report
    • Throughput Curve
    • Performance Curves
  • Final Thoughts
Read more...

more
0 0 776
79 Subscribers