- Home
- :
- All Communities
- :
- Services
- :
- Esri Technical Support
- :
- Esri Technical Support Blog
- :
- Monitoring web service requests using Fiddler
Monitoring web service requests using Fiddler
- Subscribe to RSS Feed
- Mark as New
- Mark as Read
- Bookmark
- Subscribe
- Printer Friendly Page
In a previous blog post, my esteemed colleague and board game nemesis Kelly Gerrow-Wilcox discussed the basics of capturing web traffic in a web browser using the built in browser developer tools. But what about when you’re consuming services in ArcGIS Pro, ArcMap or any other non-browser client? Enter: web traffic capturing tools. There are numerous free tools (such as Fiddler, Wireshark, Charles and others) which allow users to capture web traffic from their computers. This blog will focus on capturing HTTP/HTTPS traffic using Fiddler. I've chosen Fiddler because of its relatively simple interface and broad adoption within Esri Technical Support.
Basics: download, configuration and layout
Fiddler can be downloaded here. After installation, the only critical configuration that needs to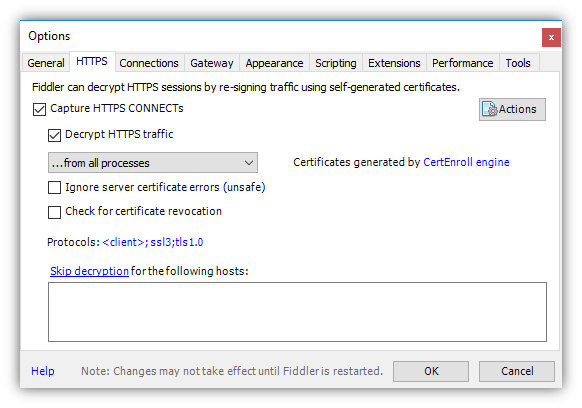 occur is to enable it to capture traffic over HTTPS.
- With Fiddler open go to Tools > Options
- In the pane that opens, check Capture HTTPS CONNTECTs and Decrypt HTTPS traffic. (This allows you to capture any requests sent using HTTPS, which is slowly but inevitably replacing HTTP as the protocol for transferring data across the web).
If it’s necessary to capture network traffic from a mobile device, some extra configuration is required. Both the mobile device and the machine where Fiddler is installed will need to be using the same wifi network. The following documents outline the steps to capture mobile traffic:
- http://docs.telerik.com/fiddler/Configure-Fiddler/Tasks/ConfigureForiOS
- http://docs.telerik.com/fiddler/Configure-Fiddler/Tasks/ConfigureForAndroid
- http://docs.telerik.com/fiddler/Configure-Fiddler/Tasks/MonitorWindowsPhone7
The Fiddler application itself is split into two main sections; the Web Session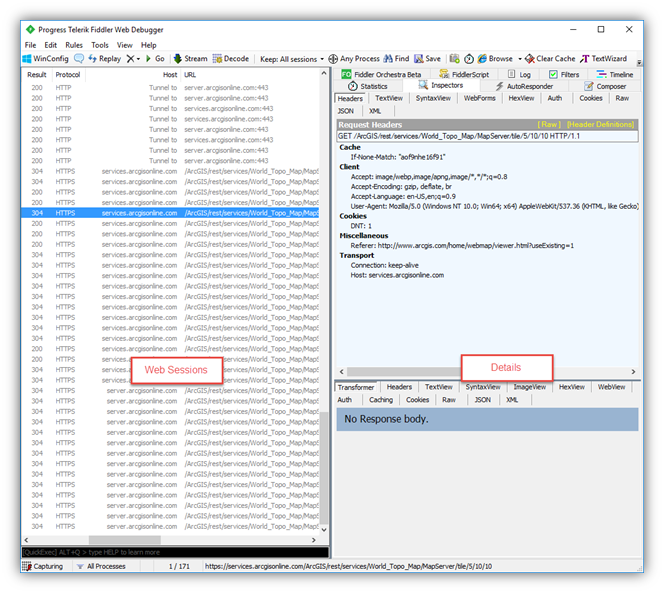 s list and the…other pane (I couldn’t find an official name so for the purposes of this blog we’ll refer to it as the Details pane).
The Web Sessions pane includes a sequential list of every request sent by the client to a web server. Important information contained here includes:
- The type of protocol used (HTTP or HTTPS)
- Which server the request was sent to, and the full URL
- The HTTP/HTTPS response code (here’s a description of what these mean)
- The size of the body of the response (in bytes)
- The content type (image, text, etc)
Note: the columns in the Web Sessions pane can be custom configured by right clicking anywhere in the headers and selecting Customize Columns. Some useful fields to turn on can be:
- Overall Elapsed (available under Collection: Session Timers. This is the overall time it takes for the request to be sent and returned)
- ClientBeginRequest (available under Collection: Session Timers. This is the time your software first began sending the request, using your computer’s time)
- X -HostIP (Select Collection: Session Flags and manually enter in the Header Name. This is the IP address of the server destination of the request)
If you click a single web session, that triggers the Details pane to populate with a wide variety of information for that specific request.
Intermediate: What do these details mean? Do they mean things? Let's find out!
There are numerous tabs in the Details pane. The most useful (for our purposes) are Timeline, Statistics, and Inspectors. The others are all advanced functionality outside of the scope of this blog.
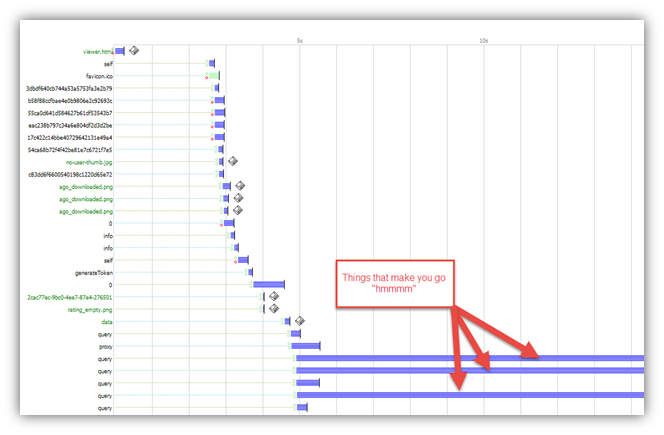
The Statistics and Timeline tabs are both helpful when investigating any performance related issue, for example if a service is taking a long time to load in the Map Viewer. The Timeline tab is useful for identifying which request in a multi-request process is acting as a bottleneck. To utilize the Timeline tab, select multiple requests in the Web Sessions list. The timeline will display the requests in a sequential “cascade” format. Any requests taking an unusually long time will clearly stand out with a significantly longer bar in the timeline.
Statistics displays the exact times every step of the request took, from the client initially making a connection to the last step of the client receiving the response. This breakdown is useful to potentially identifying which step in the process of a single request is acting as a bottleneck. For example, if every step is taking a fraction of a second, but there is a multi-second pause between ServerGotRequest and ServerBeginResponse that would indicate that something on the server side is causing a slowdown.
Lastly, the Inspectors tab is the where the bulk of information is displayed and likely where the vast majority of any troubleshooting will be done. Here is where the curtain is drawn back to reveal the nitty gritty of how applications interact with web services. Inspectors is further divided into two main sections; the Request information (everything related to the request sent by the client) and the Response information (everything related to the response returned by the server). Both divisions have a nearly identical set of subdivisions which display the content of the request/response in different formats. Below are the useful tabs for our purposes:
- Headers – A list of additional information that is not part of the main request. This may include information like security/authentication information, the data format of the request or response, the type of client making the request, etc. This is a good place to find an ArcGIS Online token, when relevant.
- WebForms (request specific) – Depending on the type of request, this will display a breakdown of each request parameter and the value of that parameter. For example, when submitting a search query this section will display the parameters of the query (like keywords, date ranges, etc).
- ImageView (response specific) – If the request is for an image, the ImageView will display the image which is returned. Obviously, this is particularly useful for requests involving tiled services.
- Raw – This will display the entire request or response in text format.
- JSON – If the request/response includes content in JSON format, this tab displays the content in a more human readable format. This is particularly useful for requests/responses to the REST api of ArcGIS Enterprise servers.
- XML – If the request/response includes content in XML format, this tab displays the content in a more human readable format. This is particularly useful for requests/responses to OGC services.
Advanced: That’s great Alan. But what am I supposed to actually do with this information?
How you use network traffic information is going to depend on what you’re trying to learn or solve. Checking network traffic can help identify the where and what of a problem but cannot tell you the solution. This is where your knowledge of your app, your web services and if all else fails, some good old fashioned web searching come into play. Here are a few common examples of ways to isolate the problem you’re facing:
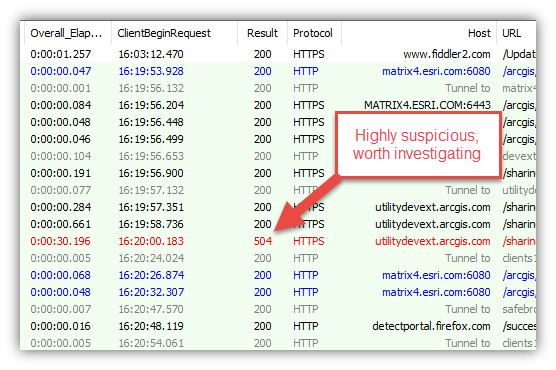
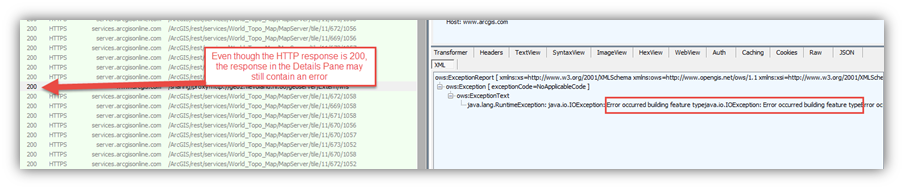
- Check the HTTP/HTTPS response code in the Web Sessions pane. Anything that isn’t 200 should be investigated (it might not necessarily be a problem, but it’s worth looking at). Again, here’s a description of what these mean. Even a 200 response could contain error messages or other useful information.
- A 304 response from a server will trigger the client (web browser, ArcMap, etc) to use the client’s cache and Fiddler is therefore not actually capturing a complete response from the server. If there is a 304 response on a critically important request, try again either in Incognito mode or clear your client’s cache.
- A 401 or 403 response typically mean the server requires some sort of authentication. This would help, for example, identify an unshared feature service in a web map which is shared publicly.
- A 504 response typically means something timed out. Use this in conjunction with the Timeline, Statistics and Overall Elapsed column mentioned above to troubleshoot performance issues.
- If you can’t find the problematic request, open the Raw, JSON or XML tabs of the response and just scroll through the requests looking for one that returns an error.
- Raw, JSON and XML contain the exact same information, just formatted differently.
- When errors occur, the error listed in the response may be more detailed than the error provided in the user interface of whichever application was being utilized.
- Find a way to ignore irrelevant requests!!
- One of the most challenging factors in troubleshooting network traffic is the volume of requests that are sent/and received for even minor actions. Below are strategies to help avoid cluttering your log with unnecessary requests.
- Turn off Capture (File > uncheck Capture Traffic) when you know Fiddler’s not capturing relevant information.
- Close any browser windows or background processes that don’t need to be running.
- If Fiddler is capturing traffic you know is not related to what you’re investigating, Filter it out of the Web Sessions by right clicking a session > Filter > select what session parameter you want to filter.
- If you’ve captured a number of requests that you know you don’t need, select and delete them.
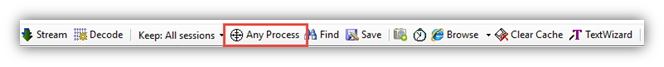
- Target Fiddler to only capture requests from a single application by clicking the ‘Any Process’ button (next to the small bullseye icon), holding and then releasing your mouse over the application you want to capture from. This would be useful, for example, to capture all traffic coming from ArcMap while ignoring everything that occurs with your browsers.
- One of the most challenging factors in troubleshooting network traffic is the volume of requests that are sent/and received for even minor actions. Below are strategies to help avoid cluttering your log with unnecessary requests.
Once you have isolated the request(s) relevant to the issue you’re investigating, the following tips can help determine what the actual problem is.
- If you can isolate the problematic request, consider what is the nature of that request in order to help determine any next steps.
- Is it a request of the service’s basic metadata? (e.g. https://sampleserver6.arcgisonline.com/arcgis/rest/services/SampleWorldCities/MapServer?f=json) That would imply there’s a problem with the service (or server) itself.
- Is service responding fine, but a single query, tile, or job request is failing? (e.g. http://sampleserver6.arcgisonline.com/arcgis/rest/services/SampleWorldCities/MapServer/export?dpi=96...) That would imply there’s a problem with the data, or perhaps with the parameters of the specific request being submitted.
- Are ALL requests to the service failing? Perhaps the entire server is down or inaccessible.
- It’s possible to resend any requests by right clicking a Web Session > Replay > Reissue and Edit.
- This is especially helpful for isolating a specific header or request parameter that might be problematic. Modify the information under WebForms or Headers to see if that fixes the problem you’re encountering or reproduces the problem you’re investigating.
- If you have a request that’s succeeding and one that’s failing, copy the headers or WebForms parameters one at a time from the request that’s working to the request that’s failing. Once the request works, you’ve successfully isolated the parameter/header in the requests that’s causing the problem.
- It’s possible to send repeated requests by right clicking a Web Session > Replay > Reissue Sequentially.
- This is helpful for capturing issues which might be intermittent. Send the request 20 or 30 times automatically and see if hit the issue you’re looking for.
- Web service query requests can be viewed in the browser with a user-friendly interface. This allows you to easily tweak and resend requests. To view a query request in the browser:
- Right click the query session
- Copy > Copy the URL
- Paste in a browser window
- Change the section in the URL “…f=json…” to “…f=html…”
- Click enter to browse to the page
Fiddler and other network capture software are not silver bullets to solve all web traffic related GIS issues, but they are useful tools to help. With a bit of practice, utilizing this type of software can help resolve a wide variety of issues when accessing web services in GIS applications.
Got any good Fiddler (or general network traffic logging) tips? Feel free to leave them in the comments!
You must be a registered user to add a comment. If you've already registered, sign in. Otherwise, register and sign in.
-
Announcements
70 -
ArcGIS Desktop
87 -
ArcGIS Enterprise
43 -
ArcGIS Mobile
7 -
ArcGIS Online
22 -
ArcGIS Pro
14 -
ArcPad
4 -
ArcSDE
16 -
CityEngine
9 -
Geodatabase
25 -
High Priority
9 -
Location Analytics
4 -
People
3 -
Raster
17 -
SDK
29 -
Support
3 -
Support.Esri.com
60
- « Previous
- Next »