- Home
- :
- All Communities
- :
- Services
- :
- Esri Technical Support
- :
- Esri Technical Support Blog
- :
- Esri Support Services Staff Maps
Esri Support Services Staff Maps
- Subscribe to RSS Feed
- Mark as New
- Mark as Read
- Bookmark
- Subscribe
- Printer Friendly Page
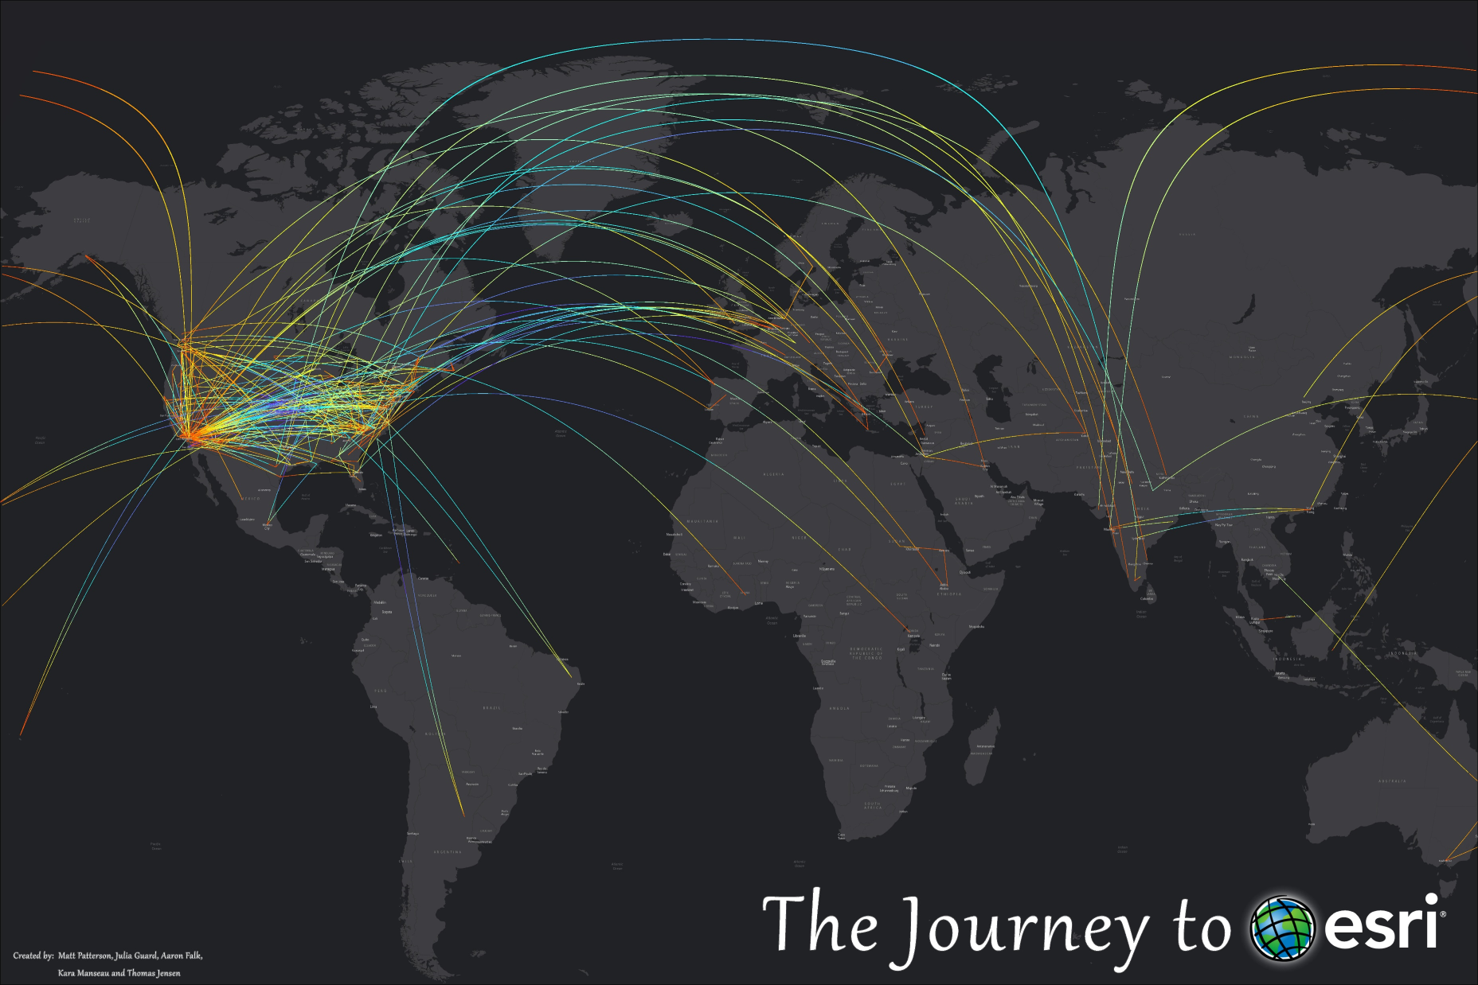
Ever wonder where the Support Analyst you are speaking with is from? Or what their journey to Esri entailed? Last year I had the pleasure of working with a few Support analysts to gather migration data from willing participants in order to create a map that reflects the diversity and spatial journey of Support Services staff as they made their way to Esri. Data for this project was collected using GeoForm, processed in ArcMap using Spatial Analysis Tools and rendered in ArcGIS Pro. Cool fact: the "lines" you see on the map are actually very small polygons created with the Buffer tool from the original line dataset; we did this to create the rainbow-looking symbology.
This map, on the other hand, shows the same data using a different approach. Support Services has main offices in both Redlands and Charlotte, so we separated the data display by region and then used a flow mapping technique to concentrate the patterns of high traffic.
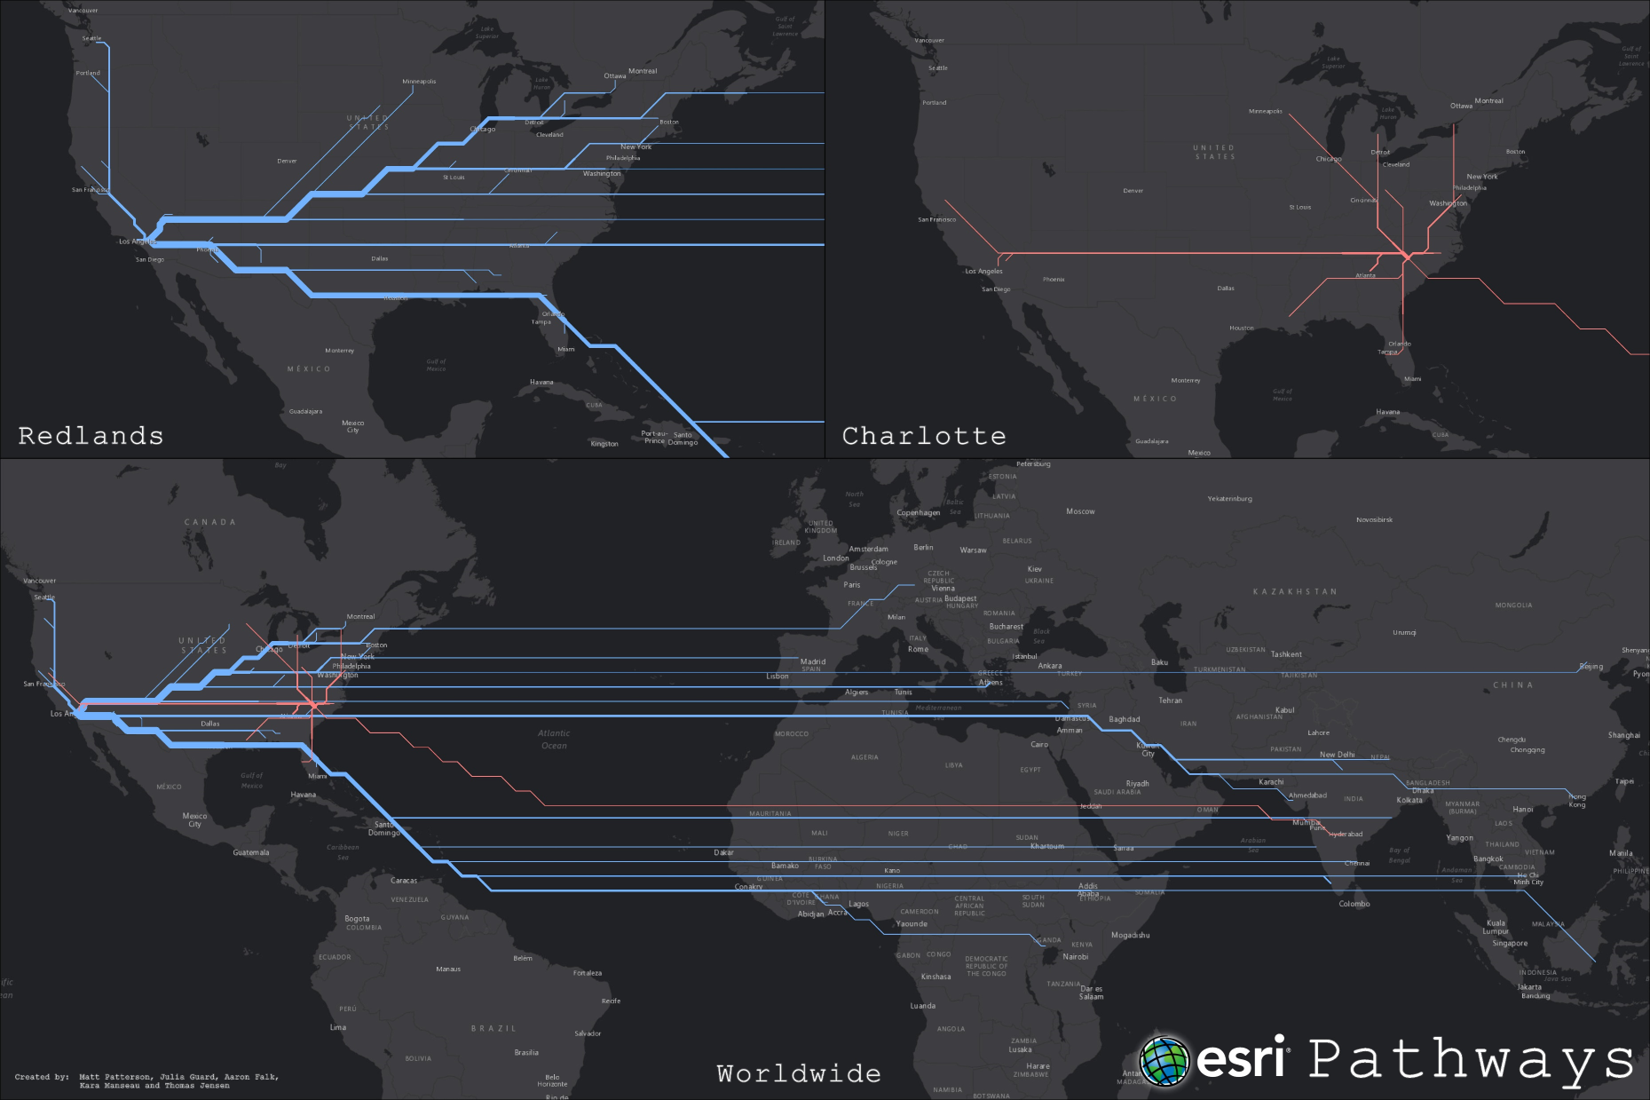
Inspired? You can show off the origin stories of your organization too; all you need is a little planning and some help from ArcGIS! See attachments to download a full size PDF of the maps above.
You must be a registered user to add a comment. If you've already registered, sign in. Otherwise, register and sign in.
-
Announcements
70 -
ArcGIS Desktop
87 -
ArcGIS Enterprise
43 -
ArcGIS Mobile
7 -
ArcGIS Online
21 -
ArcGIS Pro
14 -
ArcPad
4 -
ArcSDE
16 -
CityEngine
9 -
Geodatabase
25 -
High Priority
9 -
Location Analytics
4 -
People
3 -
Raster
17 -
SDK
29 -
Support
3 -
Support.Esri.com
60
- « Previous
- Next »