Turn on suggestions
Auto-suggest helps you quickly narrow down your search results by suggesting possible matches as you type.
Cancel
- Home
- :
- All Communities
- :
- Services
- :
- Esri Technical Support
- :
- Esri Technical Support Blog
- :
- Combining Spatial Data in ArcMap
Combining Spatial Data in ArcMap
Subscribe
35998
0
12-02-2014 08:28 AM
- Subscribe to RSS Feed
- Mark as New
- Mark as Read
- Bookmark
- Subscribe
- Printer Friendly Page
12-02-2014
08:28 AM
You want to combine your data. Okay, so which tool should you use?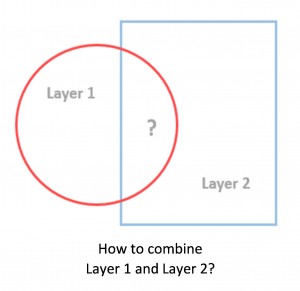
Do you ever want to combine multiple spatial datasets in ArcMap, but you aren’t sure which tool to use? You may wonder if you should use Merge, Append or Union, or if there are other tools available. Seriously – what does Dissolve do!? ArcGIS has a lot of tools that perform many useful operations, but sometimes it can be hard to figure out which one to use. Here we’ll take a look at the differences among these tools to help you decide which one will help achieve your particular goal.Merge
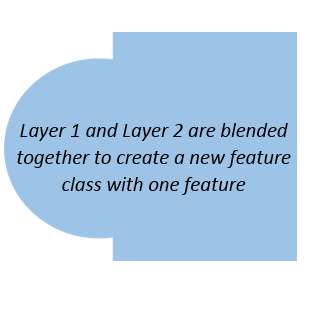
The Merge tool combines multiple input datasets of the same geometry type (e.g., polyline, polygon, or point), or tables, into a new feature class. The output will have an extent that encompasses all of the features included in the merge. The relationship of input features relative to each other does not change, so the physical bound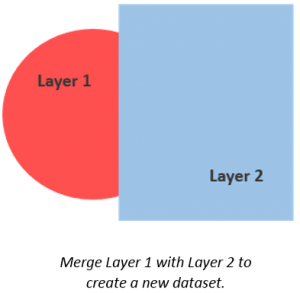 aries of the features are not actually blended together - the features simply belong to the same feature class after the Merge. Therefore, the number of features in the output is equal to the sum of features used in the Merge. No new features are created for where areas overlap.
With Merge, you can decide which attributes are transferred to the output, and these can be any combination of the input attribute fields. It is not necessary for inputs to have the same coordinate system to be merged, as the tool does this on-the-fly. However, the output defaults to the coordinate system of the first input unless specified in the Environment Settings.Example: Your colleagues collected data in different parts of the state. One collected population and age data for the western counties, while the other collected population, age, and gender information for the eastern counties. You obtain the two feature classes from your colleagues and use Merge to create a single feature class with population and age attribute information for the entire state.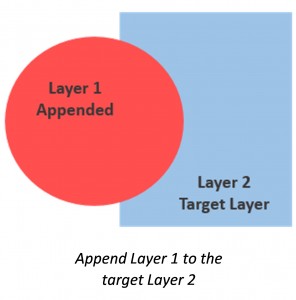 Append The Append tool does exactly what the name implies: it adds, or appends, data from one feature class to another feature class of the same type. No new dataset is actually created, so you have to be sure you want to change the original data before using this tool. You can use Append for point, line, or polygon feature classes; tables, rasters, raster catalogs, annotation feature classes, or dimensions feature classes – the only requirement is that the inputs are the same type as the target. In this case, you can choose to only append feature classes with the same schema (set of attributes, domains, and so forth), or you can choose to append different schemas. If appending a feature class with a different schema other than the target, the attributes will not be transferred to the target feature class.
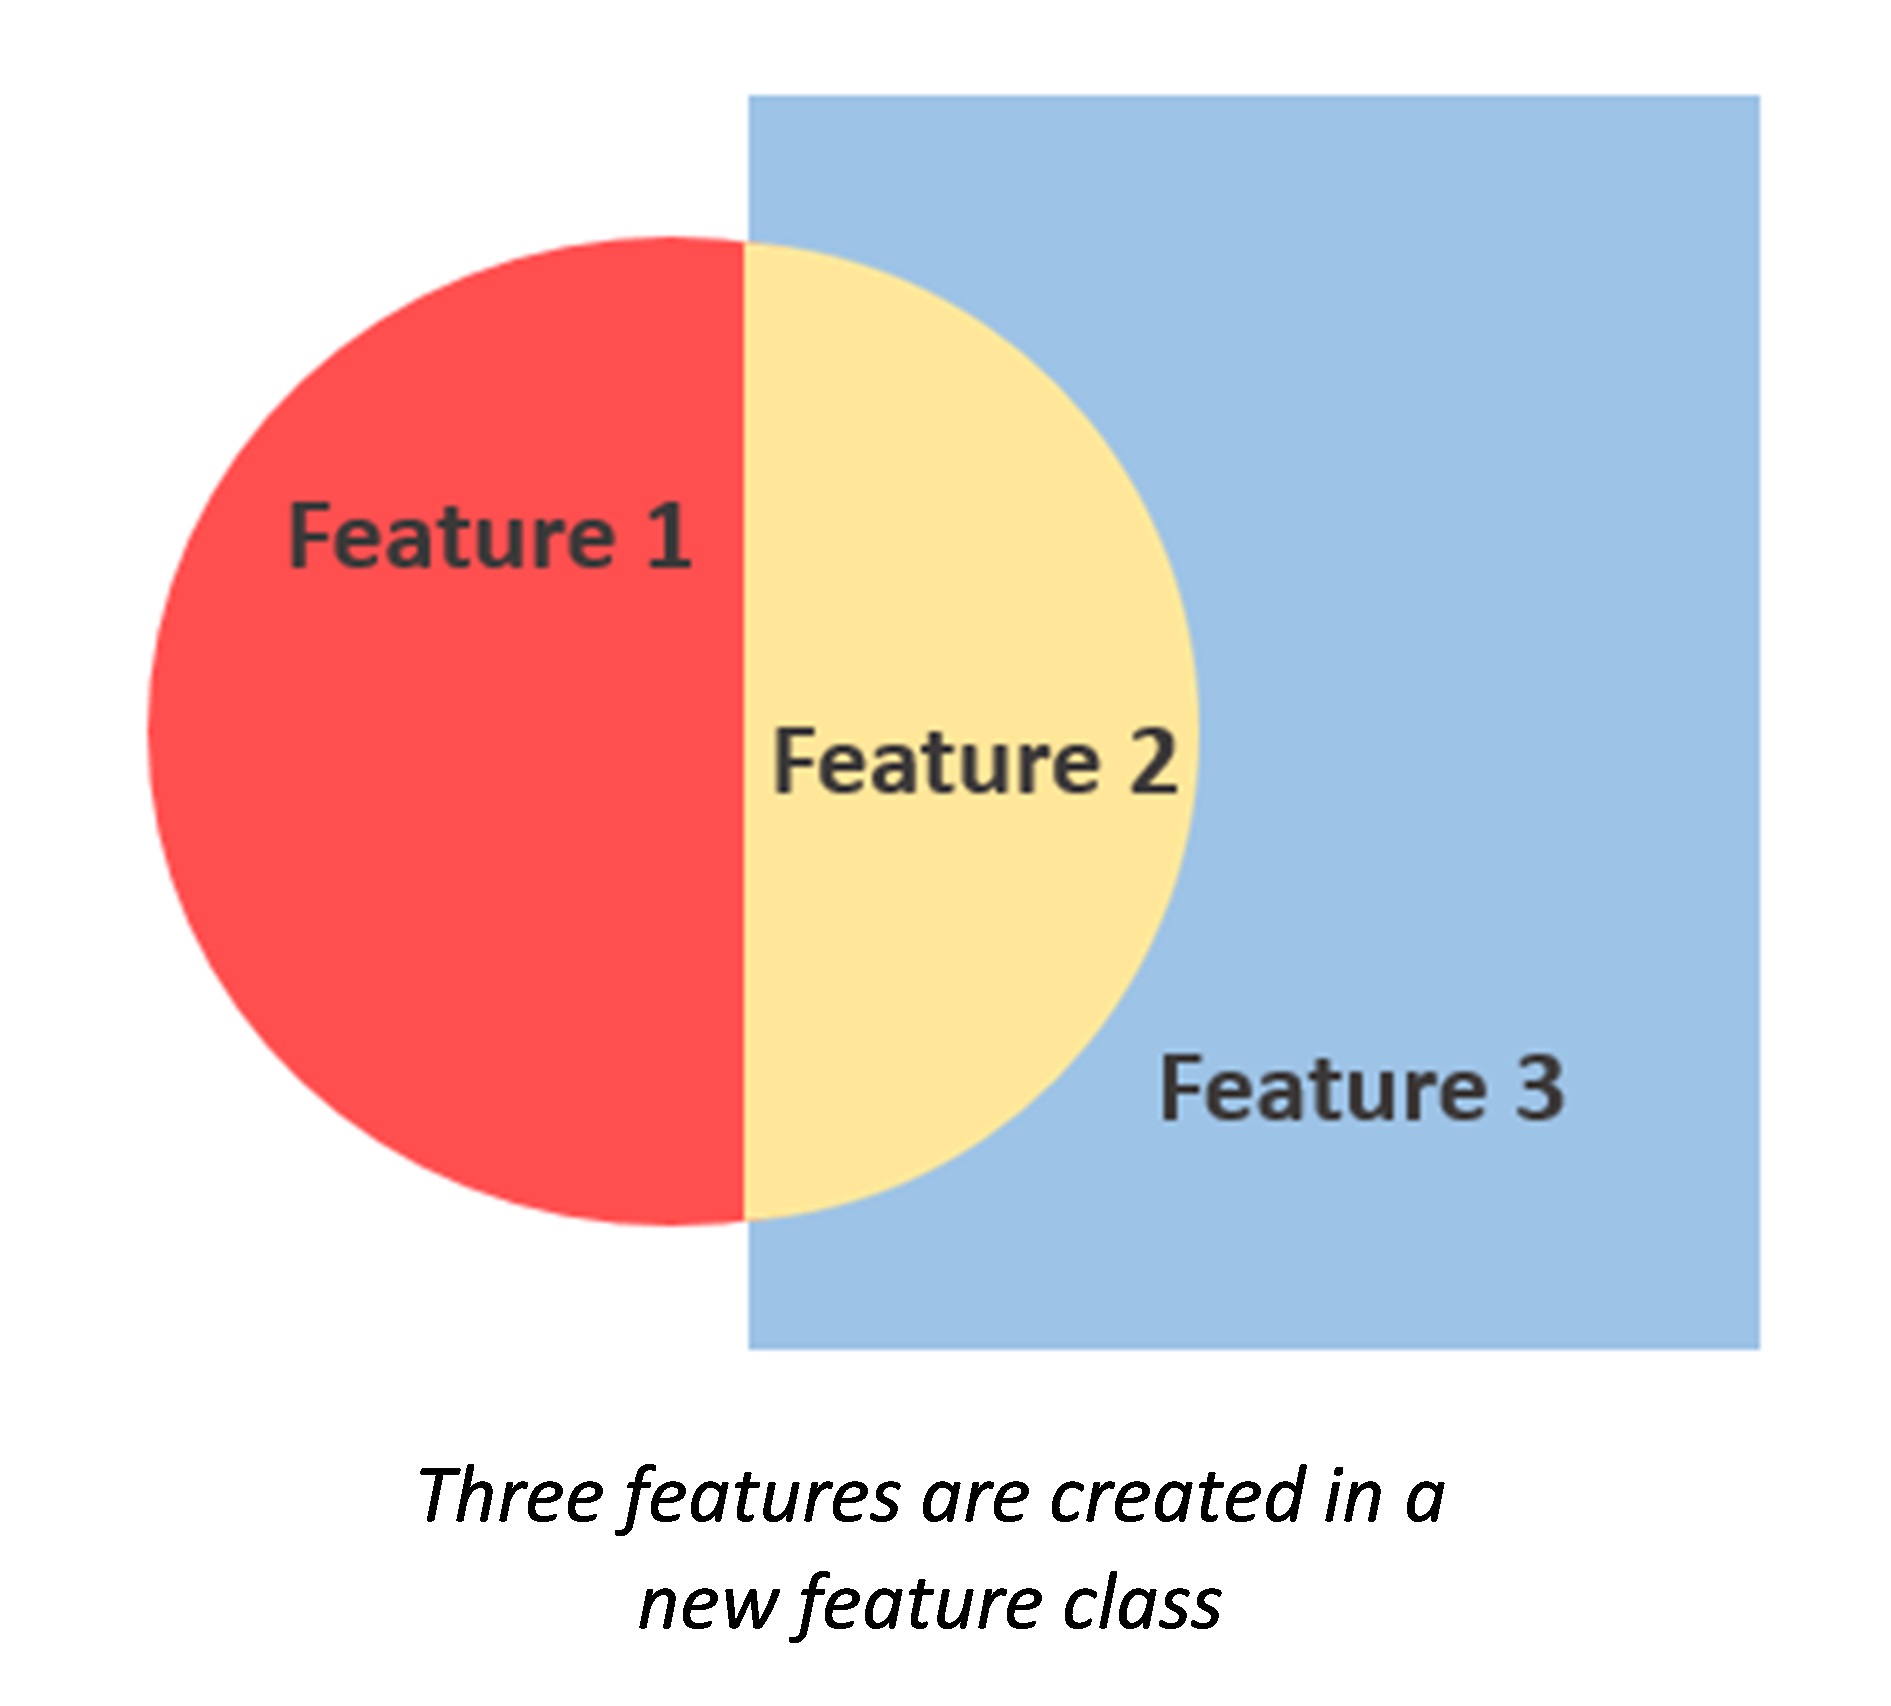
The full geometry of the underlying features is preserved, and the number of features in the output is equal to the sum of the features from the appending layers and the target layer.Example: You work for the Department of Parks and Recreation for your city, and you have a detailed feature class with all the spatial and attribute information for city parks. A new park was just finished in the downtown area, and you have been asked to update the master parks polygon feature class. Your colleague sends you a shapefile of the new park polygon with all the required attributes. After ensuring the shapefile is correct and contains the right information, use Append to add the shapefile to the master parks feature class. UnionUnion can do some nifty things, but here’s the catch: it only works with polygons. This tool is interesting because the output of the tool contains features and/or parts of features representing areas of unique intersection, as well as features and/or parts of features representing no intersection among all the features in the input feature classes. Attributes from all features involved in the intersection are contained in the output record for the newly created feature that represents the intersecting feature or feature part. Features in the output representing areas with no intersection will have the FID_<FcName> value of -1.Example: You are looking for regions with specific combinations of soil and rainfall to help you find a good place to grow certain crops. You have two feature classes: one with the location of certain soil types and the other with ranges of precipitation. You use the Union tool to find all the areas with unique combinations of rain and soil.Other Tools: DissolveDissolve is used for combining features from a single dataset based on a
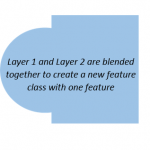 common attribute. The tool dissolves the boundaries between features to aggregate them by category. If you have a feature class with a polygon representing each state and you just want a feature class that represents the United States, use the Dissolve tool and specify the 'country' field as the dissolve attribute. If you select the multi-part option, the output contains one polygon with no boundaries between states. You can also choose to calculate statistics of attributes during the dissolve. For example, you can calculate the sum of all state populations to get the population for the entire US.Aggregate PolygonsThis tool combines polygons within a specified distance of each other into new polygon features. The input is a single polygon layer with multiple features, and the output is a polygon layer with a reduced number of polygons encompassing the area of the input features. You can set the distance for aggregation and choose to preserve orthogonal angles in the output.
Note: Aggregate everything within a 500 meter radius.Spatial JoinThe Spatial Join tool does not combine the physical features of two datasets. Rather, it appends the attributes of a layer to a different layer. A new feature class is created based on the geometry of the target features, but the attributes of the joined features are added to the output attribute table. This tool is useful when you are looking for statistics about features located in relation to other features. Additionally, the inputs can have any combination of feature types – points can be joined to polygons, polygons can be joined to lines, and so forth.Combine This tool is specific to raster datasets. The Combine tool combines raster datasets in such a way where each output pixel has a value indicating a specific combination of input values. This is really useful for categorical raster data. For example, if you have three raster datasets, and each represents a different type of risk (e.g. drought, earthquake, and floods), use the Combine tool to find all the different combinations of risk that exist throughout an area. Which areas have a high risk of earthquakes and floods, but a low risk of drought? This combination is represented by a specific value in the output of the Combine tool. IntersectThe Intersect tool calculates the geometric intersection of all input features. So what’s a geometric intersection? It’s the physical geometry of the overlapping features. If you have different input types (e.g. points and polygons), the output will use the lowest dimension; points have a lower dimension than lines, and lines are lower than polygons. Use this tool when you are only interested in the unique intersections between features in all your inputs, and when an intersection between the inputs is not important for the analysis.Erase
I include the Erase tool here because it does the opposite of the Intersect tool - the Erase tool removes overlapping areas of input feature classes. Use the Erase tool to remove features or parts of features representing an intersection between the input feature classes. The output feature class only contains features or parts of features that do not intersect with the erased feature class.
There are many tools you can use to combine, overlay, or spatially relate data that share common locations– but don’t worry. The next time you're confused about which of these tools to use, ask yourself this question: "What information do I want in my output?" Use this blog as a guide to discover the best tool for you.
Julia L. - Geodata Support Analyst
Do you ever want to combine multiple spatial datasets in ArcMap, but you aren’t sure which tool to use? You may wonder if you should use Merge, Append or Union, or if there are other tools available. Seriously – what does Dissolve do!? ArcGIS has a lot of tools that perform many useful operations, but sometimes it can be hard to figure out which one to use. Here we’ll take a look at the differences among these tools to help you decide which one will help achieve your particular goal.Merge
The Merge tool combines multiple input datasets of the same geometry type (e.g., polyline, polygon, or point), or tables, into a new feature class. The output will have an extent that encompasses all of the features included in the merge. The relationship of input features relative to each other does not change, so the physical bound
 aries of the features are not actually blended together - the features simply belong to the same feature class after the Merge. Therefore, the number of features in the output is equal to the sum of features used in the Merge. No new features are created for where areas overlap.
With Merge, you can decide which attributes are transferred to the output, and these can be any combination of the input attribute fields. It is not necessary for inputs to have the same coordinate system to be merged, as the tool does this on-the-fly. However, the output defaults to the coordinate system of the first input unless specified in the Environment Settings.Example: Your colleagues collected data in different parts of the state. One collected population and age data for the western counties, while the other collected population, age, and gender information for the eastern counties. You obtain the two feature classes from your colleagues and use Merge to create a single feature class with population and age attribute information for the entire state.
Append The Append tool does exactly what the name implies: it adds, or appends, data from one feature class to another feature class of the same type. No new dataset is actually created, so you have to be sure you want to change the original data before using this tool. You can use Append for point, line, or polygon feature classes; tables, rasters, raster catalogs, annotation feature classes, or dimensions feature classes – the only requirement is that the inputs are the same type as the target. In this case, you can choose to only append feature classes with the same schema (set of attributes, domains, and so forth), or you can choose to append different schemas. If appending a feature class with a different schema other than the target, the attributes will not be transferred to the target feature class.The full geometry of the underlying features is preserved, and the number of features in the output is equal to the sum of the features from the appending layers and the target layer.Example: You work for the Department of Parks and Recreation for your city, and you have a detailed feature class with all the spatial and attribute information for city parks. A new park was just finished in the downtown area, and you have been asked to update the master parks polygon feature class. Your colleague sends you a shapefile of the new park polygon with all the required attributes. After ensuring the shapefile is correct and contains the right information, use Append to add the shapefile to the master parks feature class.
 UnionUnion can do some nifty things, but here’s the catch: it only works with polygons. This tool is interesting because the output of the tool contains features and/or parts of features representing areas of unique intersection, as well as features and/or parts of features representing no intersection among all the features in the input feature classes. Attributes from all features involved in the intersection are contained in the output record for the newly created feature that represents the intersecting feature or feature part. Features in the output representing areas with no intersection will have the FID_<FcName> value of -1.Example: You are looking for regions with specific combinations of soil and rainfall to help you find a good place to grow certain crops. You have two feature classes: one with the location of certain soil types and the other with ranges of precipitation. You use the Union tool to find all the areas with unique combinations of rain and soil.Other Tools: DissolveDissolve is used for combining features from a single dataset based on a
 common attribute. The tool dissolves the boundaries between features to aggregate them by category. If you have a feature class with a polygon representing each state and you just want a feature class that represents the United States, use the Dissolve tool and specify the 'country' field as the dissolve attribute. If you select the multi-part option, the output contains one polygon with no boundaries between states. You can also choose to calculate statistics of attributes during the dissolve. For example, you can calculate the sum of all state populations to get the population for the entire US.Aggregate PolygonsThis tool combines polygons within a specified distance of each other into new polygon features. The input is a single polygon layer with multiple features, and the output is a polygon layer with a reduced number of polygons encompassing the area of the input features. You can set the distance for aggregation and choose to preserve orthogonal angles in the output.
Note: Aggregate everything within a 500 meter radius.Spatial JoinThe Spatial Join tool does not combine the physical features of two datasets. Rather, it appends the attributes of a layer to a different layer. A new feature class is created based on the geometry of the target features, but the attributes of the joined features are added to the output attribute table. This tool is useful when you are looking for statistics about features located in relation to other features. Additionally, the inputs can have any combination of feature types – points can be joined to polygons, polygons can be joined to lines, and so forth.Combine This tool is specific to raster datasets. The Combine tool combines raster datasets in such a way where each output pixel has a value indicating a specific combination of input values. This is really useful for categorical raster data. For example, if you have three raster datasets, and each represents a different type of risk (e.g. drought, earthquake, and floods), use the Combine tool to find all the different combinations of risk that exist throughout an area. Which areas have a high risk of earthquakes and floods, but a low risk of drought? This combination is represented by a specific value in the output of the Combine tool.
IntersectThe Intersect tool calculates the geometric intersection of all input features. So what’s a geometric intersection? It’s the physical geometry of the overlapping features. If you have different input types (e.g. points and polygons), the output will use the lowest dimension; points have a lower dimension than lines, and lines are lower than polygons. Use this tool when you are only interested in the unique intersections between features in all your inputs, and when an intersection between the inputs is not important for the analysis.EraseI include the Erase tool here because it does the opposite of the Intersect tool - the Erase tool removes overlapping areas of input feature classes. Use the Erase tool to remove features or parts of features representing an intersection between the input feature classes. The output feature class only contains features or parts of features that do not intersect with the erased feature class.
There are many tools you can use to combine, overlay, or spatially relate data that share common locations– but don’t worry. The next time you're confused about which of these tools to use, ask yourself this question: "What information do I want in my output?" Use this blog as a guide to discover the best tool for you.
Julia L. - Geodata Support Analyst
Labels
You must be a registered user to add a comment. If you've already registered, sign in. Otherwise, register and sign in.
Labels
-
Announcements
70 -
ArcGIS Desktop
87 -
ArcGIS Enterprise
43 -
ArcGIS Mobile
7 -
ArcGIS Online
21 -
ArcGIS Pro
14 -
ArcPad
4 -
ArcSDE
16 -
CityEngine
9 -
Geodatabase
25 -
High Priority
9 -
Location Analytics
4 -
People
3 -
Raster
17 -
SDK
29 -
Support
3 -
Support.Esri.com
60
- « Previous
- Next »