Turn on suggestions
Auto-suggest helps you quickly narrow down your search results by suggesting possible matches as you type.
Cancel
- Home
- :
- All Communities
- :
- Services
- :
- Esri Technical Support
- :
- Esri Technical Support Blog
- :
- Preparing for the flood: Will your GIS Server sink...
Preparing for the flood: Will your GIS Server sink or swim?
Subscribe
5192
1
06-14-2012 02:50 AM
- Subscribe to RSS Feed
- Mark as New
- Mark as Read
- Bookmark
- Subscribe
- Printer Friendly Page
06-14-2012
02:50 AM
I’ve been doing some load testing against ArcGIS Server recently, and it came to mind that while we often tell users to use load testing tools prior to going public with a GIS application, we don’t go into too much detail into how to go about setting up those tests. In this blog, I’ll describe how to configure and run tests using an open source Java tool called JMeter to assist with load testing your GIS Server installation and application.First, what is JMeter?
From the JMeter website:
“The Apache JMeter™ desktop application is open source software, a 100% pure Java application designed to load test functional behavior and measure performance. It was originally designed for testing Web Applications but has since expanded to other test functions. “What can I do with it?
“Apache JMeter may be used to test performance both on static and dynamic resources (files, Servlets, Perl scripts, Java Objects, Data Bases and Queries, FTP Servers and more). It can be used to simulate a heavy load on a server, network or object to test its strength or to analyze overall performance under different load types. You can use it to make a graphical analysis of performance or to test your server/script/object behavior under heavy concurrent load."
That’s all great, but here’s what I do with it:
I use JMeter to simulate the load of a group of users concurrently working with ArcGIS Server. These simulated users are SUPERHUMAN, as my JMeter tests fire off requests at the rate of hundreds or thousands per minute. I recently tested memory utilization of 10.1 after sending literally 100 million + query feature requests to ArcGIS Server on an AMI over the course of a week or so. (You’ll be happy to know that I found that memory was well managed during this test).
Remember that JMeter is not a browser. While the server is going to complete whatever operation you submit to it, JMeter will not render the response graphically. You get results in the form of a PASS/FAIL notification.
Nice. Let’s put that together and run a test. Allow me to walk you through it.What do I need?
Great question. You’ll need:
There’s not really an installer for JMeter, everything you need is inside the application folder. The first thing to do is open the JMeterbin folder, and have a look at the JMeter.bat file. On line 71, find the line that reads as follows:set HEAP=-Xms512m –Xmx512m
This variable defines the amount of memory dedicated to the Java Heap.
I’d increase this to 1024, devoting a full gigabyte of memory to the JVM, like so:set HEAP=-Xms1024m -Xmx1024m
Otherwise, particularly on larger tests, you run the risk of going over the Java Heap threshold, which can cause the JVM dedicated to JMeter to fail.
After you’ve downloaded JMeter, installed the JRE, and set the JAVA_HOME environment variable to point to your Java install location, it’s time to fire up JMeter. To do this, open a command prompt and navigate down into the JMeter BIN directory (the same place where JMeter.bat lives). Call JMeter.bat from a command line, and the JMeter application will open.
With JMeter open, it’s time to first define some defaults. To do that, right click on the Test Plan icon (It looks like a beaker) and add an HTTP Request Defaults Element. (Add>Config Element>HTTP Request Defaults)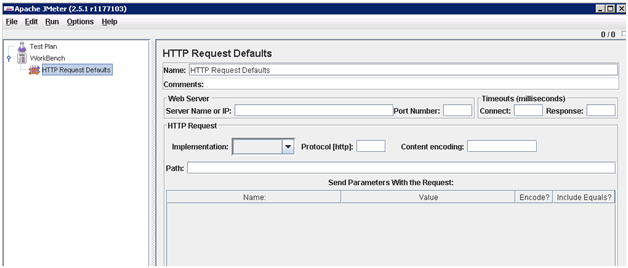
Now we will populate some of these parameters on the HTTP Request Defaults page.
Server name or IP: that’s self-explanatory. Insert the IP address or hostname of the machine that runs ArcGIS Server (or the proxy that points to server). I don’t usually define any connect or response timeouts here in JMeter. The path will be the path to your SOAP or REST endpoint – to the operation you want to perform (query, export map, etc.). The parameters that are sent with the request are similar to the parameters that are defined if you’re querying through the REST Services Directory.
I find it helpful to use the Fiddler tool to capture the URLs of queries sent either through the service’s REST page or your web application to assist with populating these parameters.
For instance, you may issue a query based on a set of X/Y coordinates with the intention of retrieving some attributes for a given feature. In that case, you may capture a URL similar to the following in Fiddler:
In this URL, I’m issuing a query to layer ‘0’ in a service called ‘usa’ serviced from port 6080 on machine called ‘randall’.
I’m not using any real SQL operators (the where clause), nor am I looking for a specific text attribute (text). I don’t care about the object ID, or the time element. I do care about the geometry, that’s where my XY values are specified. In fact, the only elements I care about in this test is the spatial reference (4326), the spatial relationship (intersect), the outfields (*, since I want them all), and I’m submitting the geometry as a point. Finally, for this test, I would like for the server to respond to the requests I send in JSON format. With that in mind, I can truncate the URL that I’ll be parsing a bit, to make setting up the JMeter test a bit more manageable:
Once I’ve gathered these defaults, I putthese inputs into my JMeter project: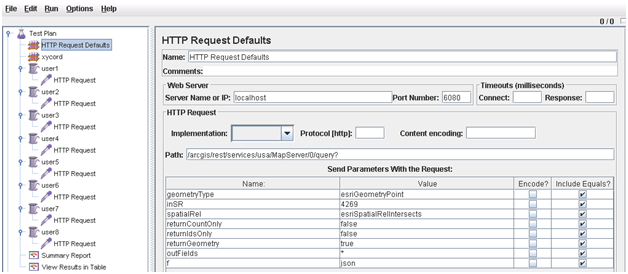
Next, I’ll need to set up some simulated users. While we’ve got the request defaults down, we want to test with a good many values – in other words, we don’t want our application to just take the same request over and over, that’s too easy. It’s best if we can test with many different samples. In JMeter, this is accomplished by creating ‘thread groups’.
Right-click on the test plan and select ‘Add’, then ‘Threads (Users). In my case, we’re simulating a load of 16 users, so each thread group will contain 2 threads. I want to see how much load my application can take before it fails, so I’m setting this test to loop forever.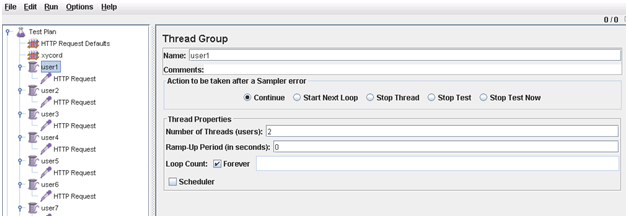
Once the Thread Groups are set up, we’ll need to set up the actual requests, which contain the defaults we set up earlier, as well as the variables that we want to pass in our requests. To that end, right click on a Thread Group; choose ‘Add’, ‘Config Element’, and then ‘HTTP request defaults’. This screen should look familiar; it’s exactly like the defaults we originally created.
In this case, the objective of the test is to see how much load the server can handle if many hundreds of thousands of query requests are sent to gather the attributes of a feature based on XY coordinates passed through the query.
So, for each request sent by JMeter, the only query element that changes from request to request will be the input point geometry. To that end, I’ve compiled a .CSV file, and set up a CSV Data Set Configuration element in my test project (Add>Config element>CSV data set Config). Your data source doesn’t have to be CSV, you can use a database table if you prefer – use a JDBC connection for that.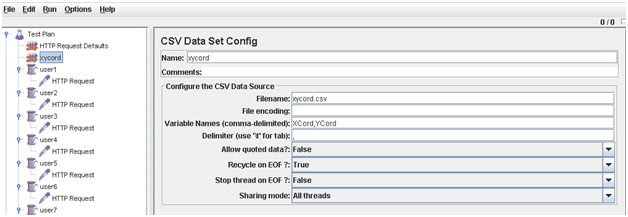
Per the figure above, my CSV file is called xycord.csv (I’ve got the CSV stored in the same folder as my test plan – if yours is stored somewhere else, set the filename to the absolute path where it’s located.
Be sure to set the variable names properly – if there are spaces and commas in your CSV file; make sure that this element reflects those spaces. The comma delimitation here only separates variable names in the CSV – the actual delimiter used in the CSV file is described in the ‘Delimiter’ parameter. Since I’m allowing my test to run until I force it to stop, I’m recycling the requests and am not stopping when JMeter detects that the end of the file is reached.
For my test, I’ve replicated each HTTP request parameter for each of the users that I’m simulating in the thread groups I’ve set up.
Now it’s time to test. Save the test plan.
In JMeter, go to ‘Run’, then ‘Start’. Click on one of the reports.
With luck, your requests will run. If the error percentage you get is 100%, then you’re likely shooting bad requests.
You can examine the requests you’re sending to the server by working with the Fiddler tool:
If Fiddler is installed on the same machine as JMeter, then in the main HTTP request defaults page, you may force traffic to go through the Fiddler proxy so that requests and subsequent responses are captured. By default, Fiddler listens on port 8888, so you can set up JMeter as follows: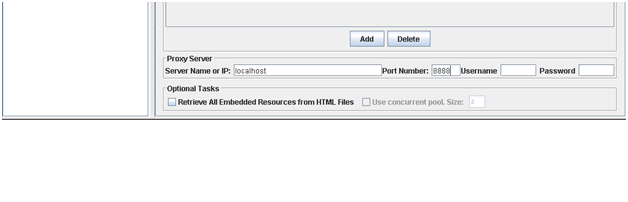
When you start your JMeter run again, Fiddler will capture the traffic, which will allow you to see what JMeter is passing so that you may make adjustments according to your needs.A Few Tips
Use as few listeners as possible. For smaller tests, the graphical counters are great. These counters are memory intensive, however, and I’ve crashed my JVM with larger tests when running with counters. I just use the Summary Report – it’s got the information I need.
Consider using JMeter from a command line interface once your configuration is set up. The Command Line option is minimally resource intensive.
That’s about it for this installment. I’ll follow up with additional testing workflows as I can.Randall W. - Server Support Analyst
From the JMeter website:
“The Apache JMeter™ desktop application is open source software, a 100% pure Java application designed to load test functional behavior and measure performance. It was originally designed for testing Web Applications but has since expanded to other test functions. “What can I do with it?
“Apache JMeter may be used to test performance both on static and dynamic resources (files, Servlets, Perl scripts, Java Objects, Data Bases and Queries, FTP Servers and more). It can be used to simulate a heavy load on a server, network or object to test its strength or to analyze overall performance under different load types. You can use it to make a graphical analysis of performance or to test your server/script/object behavior under heavy concurrent load."
That’s all great, but here’s what I do with it:
I use JMeter to simulate the load of a group of users concurrently working with ArcGIS Server. These simulated users are SUPERHUMAN, as my JMeter tests fire off requests at the rate of hundreds or thousands per minute. I recently tested memory utilization of 10.1 after sending literally 100 million + query feature requests to ArcGIS Server on an AMI over the course of a week or so. (You’ll be happy to know that I found that memory was well managed during this test).
Remember that JMeter is not a browser. While the server is going to complete whatever operation you submit to it, JMeter will not render the response graphically. You get results in the form of a PASS/FAIL notification.
Nice. Let’s put that together and run a test. Allow me to walk you through it.What do I need?
Great question. You’ll need:
- Your ArcGIS Server machine. You can test Java or .Net, on any supported OS.
- Somewhere to install JMeter. This can be the same machine as your ArcGIS Server, but I find that you’ll get more accurate results if JMeter is installed somewhere else. That’s because as it runs, the JMeter application’s Java container will chew up a good bit of RAM, which may skew your results. JMeter is a pure Java tool, so it can run on Windows and Linux. For my testing, I’m running JMeter on Win08.
- Fiddler and Firebug. I find that the Fiddler tool is helpful for troubleshooting failed requests and the like. It’s also good for helping to build requests to be used in your test plan. Fiddler and Firebug (add-on for the Firefox browser) are both excellent lightweight tools for testing and debugging.
- The Java Runtime Environment (JRE) installed and an environment variable pointing to JAVA_HOME.
There’s not really an installer for JMeter, everything you need is inside the application folder. The first thing to do is open the JMeterbin folder, and have a look at the JMeter.bat file. On line 71, find the line that reads as follows:set HEAP=-Xms512m –Xmx512m
This variable defines the amount of memory dedicated to the Java Heap.
I’d increase this to 1024, devoting a full gigabyte of memory to the JVM, like so:set HEAP=-Xms1024m -Xmx1024m
Otherwise, particularly on larger tests, you run the risk of going over the Java Heap threshold, which can cause the JVM dedicated to JMeter to fail.
After you’ve downloaded JMeter, installed the JRE, and set the JAVA_HOME environment variable to point to your Java install location, it’s time to fire up JMeter. To do this, open a command prompt and navigate down into the JMeter BIN directory (the same place where JMeter.bat lives). Call JMeter.bat from a command line, and the JMeter application will open.

With JMeter open, it’s time to first define some defaults. To do that, right click on the Test Plan icon (It looks like a beaker) and add an HTTP Request Defaults Element. (Add>Config Element>HTTP Request Defaults)

Now we will populate some of these parameters on the HTTP Request Defaults page.
Server name or IP: that’s self-explanatory. Insert the IP address or hostname of the machine that runs ArcGIS Server (or the proxy that points to server). I don’t usually define any connect or response timeouts here in JMeter. The path will be the path to your SOAP or REST endpoint – to the operation you want to perform (query, export map, etc.). The parameters that are sent with the request are similar to the parameters that are defined if you’re querying through the REST Services Directory.
I find it helpful to use the Fiddler tool to capture the URLs of queries sent either through the service’s REST page or your web application to assist with populating these parameters.
For instance, you may issue a query based on a set of X/Y coordinates with the intention of retrieving some attributes for a given feature. In that case, you may capture a URL similar to the following in Fiddler:
http://randall:6080/arcgis/rest/services/usa/MapServer/0/query?where=
&text=&objectIds=&time=&geometry=-119.78861600000%2C35.30318900030
&geometryType=esriGeometryPoint&inSR=4269&spatialRel=esriSpatialRel
Intersects&relationParam=&outFields=*&returnGeometry=true&maxAllowable
Offset=&outSR=&returnIdsOnly=false&returnCountOnly=false&orderByFields
=&groupByFieldsForStatistics=&outStatistics=&returnZ=false&returnM=false
&f=pjson
In this URL, I’m issuing a query to layer ‘0’ in a service called ‘usa’ serviced from port 6080 on machine called ‘randall’.
I’m not using any real SQL operators (the where clause), nor am I looking for a specific text attribute (text). I don’t care about the object ID, or the time element. I do care about the geometry, that’s where my XY values are specified. In fact, the only elements I care about in this test is the spatial reference (4326), the spatial relationship (intersect), the outfields (*, since I want them all), and I’m submitting the geometry as a point. Finally, for this test, I would like for the server to respond to the requests I send in JSON format. With that in mind, I can truncate the URL that I’ll be parsing a bit, to make setting up the JMeter test a bit more manageable:
http://localhost:6080/ArcGIS/rest/services/usa/MapServer/0/query?&geometry
=-149.54518800000%2C70.42196900010&geometryType=esriGeometryPoint&inSR=4269
&spatialRel=esriSpatialRelIntersects&returnCountOnly=false&returnIdsOnly=
false&returnGeometry=true&outFields=*&f=json
Once I’ve gathered these defaults, I putthese inputs into my JMeter project:

Next, I’ll need to set up some simulated users. While we’ve got the request defaults down, we want to test with a good many values – in other words, we don’t want our application to just take the same request over and over, that’s too easy. It’s best if we can test with many different samples. In JMeter, this is accomplished by creating ‘thread groups’.
Right-click on the test plan and select ‘Add’, then ‘Threads (Users). In my case, we’re simulating a load of 16 users, so each thread group will contain 2 threads. I want to see how much load my application can take before it fails, so I’m setting this test to loop forever.

Once the Thread Groups are set up, we’ll need to set up the actual requests, which contain the defaults we set up earlier, as well as the variables that we want to pass in our requests. To that end, right click on a Thread Group; choose ‘Add’, ‘Config Element’, and then ‘HTTP request defaults’. This screen should look familiar; it’s exactly like the defaults we originally created.
In this case, the objective of the test is to see how much load the server can handle if many hundreds of thousands of query requests are sent to gather the attributes of a feature based on XY coordinates passed through the query.
So, for each request sent by JMeter, the only query element that changes from request to request will be the input point geometry. To that end, I’ve compiled a .CSV file, and set up a CSV Data Set Configuration element in my test project (Add>Config element>CSV data set Config). Your data source doesn’t have to be CSV, you can use a database table if you prefer – use a JDBC connection for that.

Per the figure above, my CSV file is called xycord.csv (I’ve got the CSV stored in the same folder as my test plan – if yours is stored somewhere else, set the filename to the absolute path where it’s located.
Be sure to set the variable names properly – if there are spaces and commas in your CSV file; make sure that this element reflects those spaces. The comma delimitation here only separates variable names in the CSV – the actual delimiter used in the CSV file is described in the ‘Delimiter’ parameter. Since I’m allowing my test to run until I force it to stop, I’m recycling the requests and am not stopping when JMeter detects that the end of the file is reached.
For my test, I’ve replicated each HTTP request parameter for each of the users that I’m simulating in the thread groups I’ve set up.
Now it’s time to test. Save the test plan.
In JMeter, go to ‘Run’, then ‘Start’. Click on one of the reports.
With luck, your requests will run. If the error percentage you get is 100%, then you’re likely shooting bad requests.
You can examine the requests you’re sending to the server by working with the Fiddler tool:
If Fiddler is installed on the same machine as JMeter, then in the main HTTP request defaults page, you may force traffic to go through the Fiddler proxy so that requests and subsequent responses are captured. By default, Fiddler listens on port 8888, so you can set up JMeter as follows:

When you start your JMeter run again, Fiddler will capture the traffic, which will allow you to see what JMeter is passing so that you may make adjustments according to your needs.A Few Tips
Use as few listeners as possible. For smaller tests, the graphical counters are great. These counters are memory intensive, however, and I’ve crashed my JVM with larger tests when running with counters. I just use the Summary Report – it’s got the information I need.
Consider using JMeter from a command line interface once your configuration is set up. The Command Line option is minimally resource intensive.
That’s about it for this installment. I’ll follow up with additional testing workflows as I can.Randall W. - Server Support Analyst
Labels
1 Comment
You must be a registered user to add a comment. If you've already registered, sign in. Otherwise, register and sign in.
Labels
-
Announcements
70 -
ArcGIS Desktop
87 -
ArcGIS Enterprise
43 -
ArcGIS Mobile
7 -
ArcGIS Online
21 -
ArcGIS Pro
14 -
ArcPad
4 -
ArcSDE
16 -
CityEngine
9 -
Geodatabase
25 -
High Priority
9 -
Location Analytics
4 -
People
3 -
Raster
17 -
SDK
29 -
Support
3 -
Support.Esri.com
60
- « Previous
- Next »