Turn on suggestions
Auto-suggest helps you quickly narrow down your search results by suggesting possible matches as you type.
Cancel
- Home
- :
- All Communities
- :
- Services
- :
- Esri Technical Support
- :
- Esri Technical Support Blog
- :
- JavaScript Debugging Tips Part III – Advanced Goog...
JavaScript Debugging Tips Part III – Advanced Google Chrome Developer Tools
Subscribe
15084
1
06-14-2017 03:30 AM
- Subscribe to RSS Feed
- Mark as New
- Mark as Read
- Bookmark
- Subscribe
- Printer Friendly Page
06-14-2017
03:30 AM
This blog post is the third in a series of JavaScript debugging tips and tricks to help you on your way. See JavaScript Debugging Tips Part I and also JavaScript Debugging Tips Part II for our previous segments.
In the past two JavaScript Debugging Tips posts on the Esri Support blog, we looked at the Network Tab and the Console Tab as part of the Google Chrome Developer Tools. While most modern browsers have some form of developer tools, here we use Chrome for our examples.
Our goal for this third blog post in the series is to introduce more advanced tips and tricks to enable you to more effectively debug and troubleshoot your JavaScript code. Specifically, we will focus on three areas: enhanced messaging to the console, better ways to set breakpoints using conditions specified at runtime, and a more efficient way of stepping through breakpoints in the Sources tab with a method called blackboxing.Part 1: Console.table
Console.log is our primary debugging function, but this function's output can be a bit difficult to read (especially when viewing a lot of data). One way to enhance our console log messaging and view data more easily is to display a list of objects as a table, which is accomplished using the console.table function. This function takes one mandatory argument, which must be an array or an object, and one additional optional parameter. Each element in the array is a row in the table.
Let’s take a look at the Console Table sample.
1. Open the Chrome Developer Tools by using shortcut keys (Windows: Control + Shift + I, and Mac: Command + Option + I), or by navigating to the top right-hand pane of the browser, clicking the three grey vertical dots, and choosing “More tools” > “Developer tools”.
2. Select the console tab.
3. Click “Perform Query” in the sample application. This performs a query task to view all counties in Connecticut. The code uses the console.table to print the results in a table as shown below.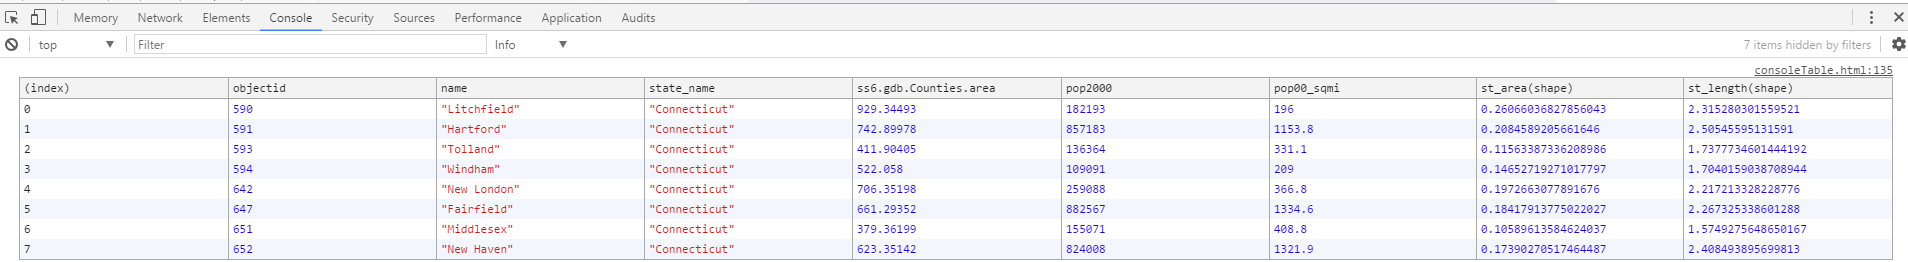
Every row in the table shows all attributes for a specific county. Next, we use the console.log to compare the console.log and console.table. This function will print a line with an array of objects.
Once we expand the array, we can view the objects in a list.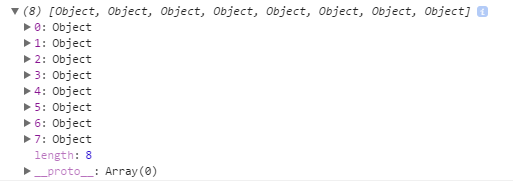
To view the attributes, we must expand the objects in the list.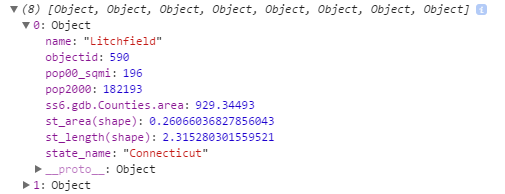 While we can access the attributes of one feature when using console.log, we can view all attributes for all features at once using console.table! The image below shows both functions in the console window.
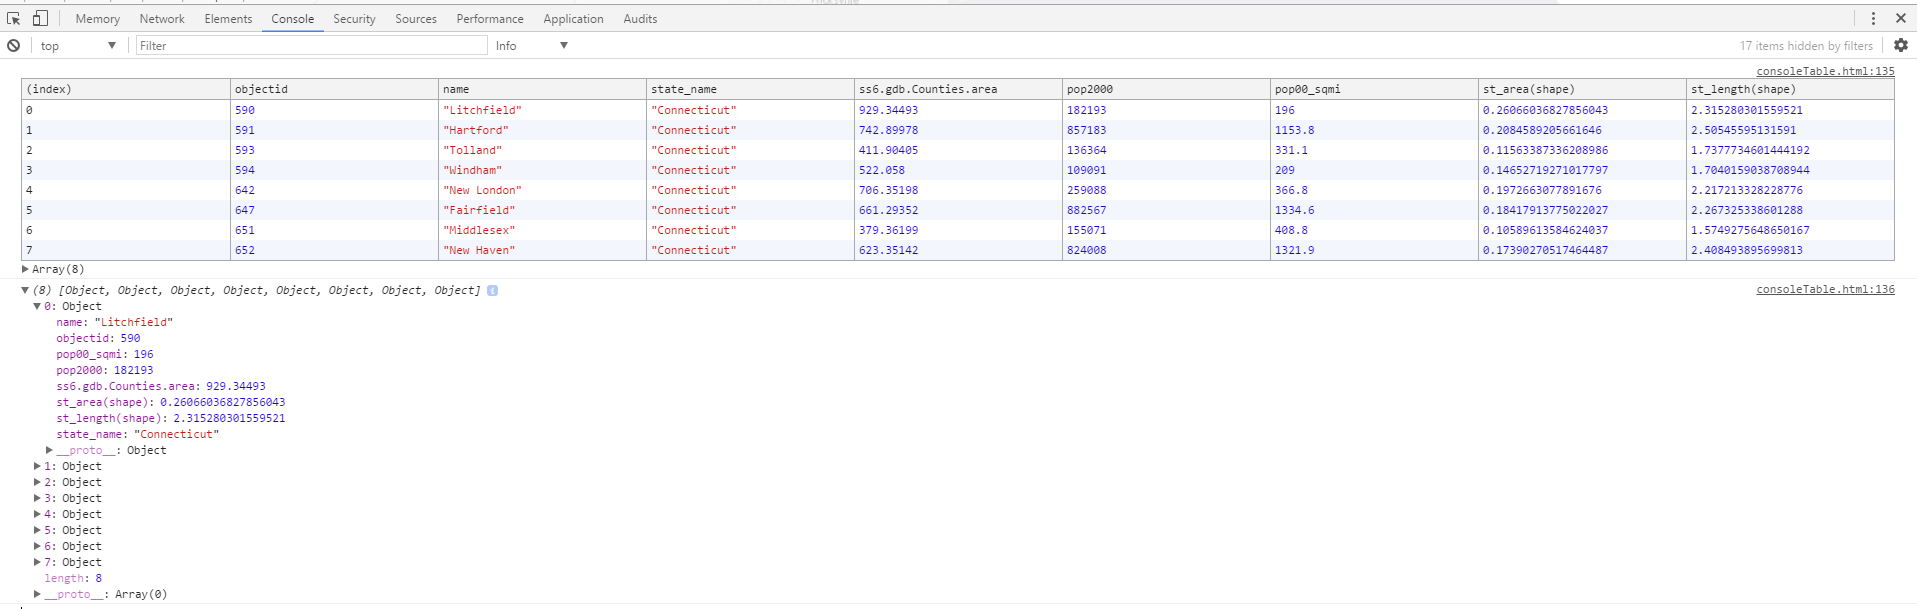 Part 2: Conditional Breakpoints
In JavaScript Debugging Tips Part II, we talked about setting a breakpoint in the Sources tab, refreshing the application, and pausing the application at that line of code. This is a great way to examine your code and how functions are called, and where potential areas of trouble could arise.
However, sometimes we don’t want the breakpoint to be reached every time. Sometimes we only want the breakpoint to be reached if certain conditions are met. While we could write some logic code in the form of a loop to check for values, there is an easier way to do this at runtime.
For example, let’s look at a sample.
1. Open the Edit Features sample and the Chrome Developer Tools.
2. Navigate to the Sources tab, and left-click line 301 to set a breakpoint there.
3. After the breakpoint is set, right-click the breakpoint and select “Edit breakpoint…”. Note: We could also get here by first right-clicking line 301 and selecting “Add conditional breakpoint…”.
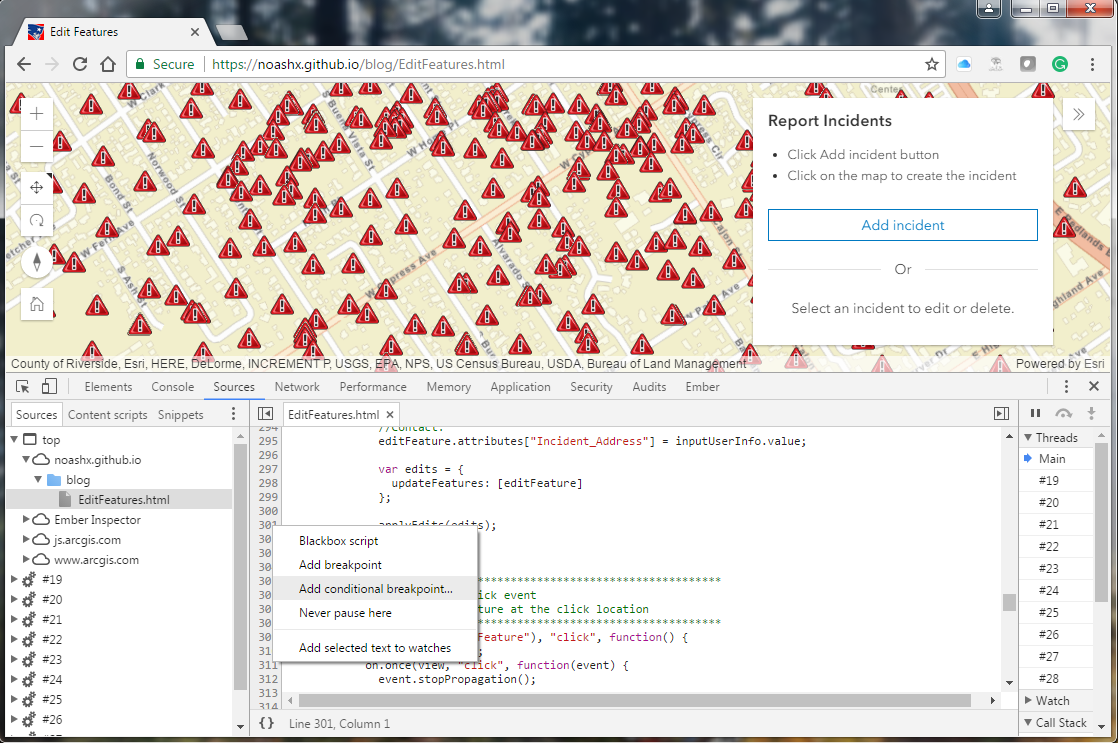
4. Set a condition whereby the breakpoint will be reached only if the user inputs “test” into the “Contact:” field when updating a feature. Here is the code: editFeature.attributes["Incident_Address"] == “test”Note: We do not want to use "=" because this assigns a value and thus always returns true, so we must use "==".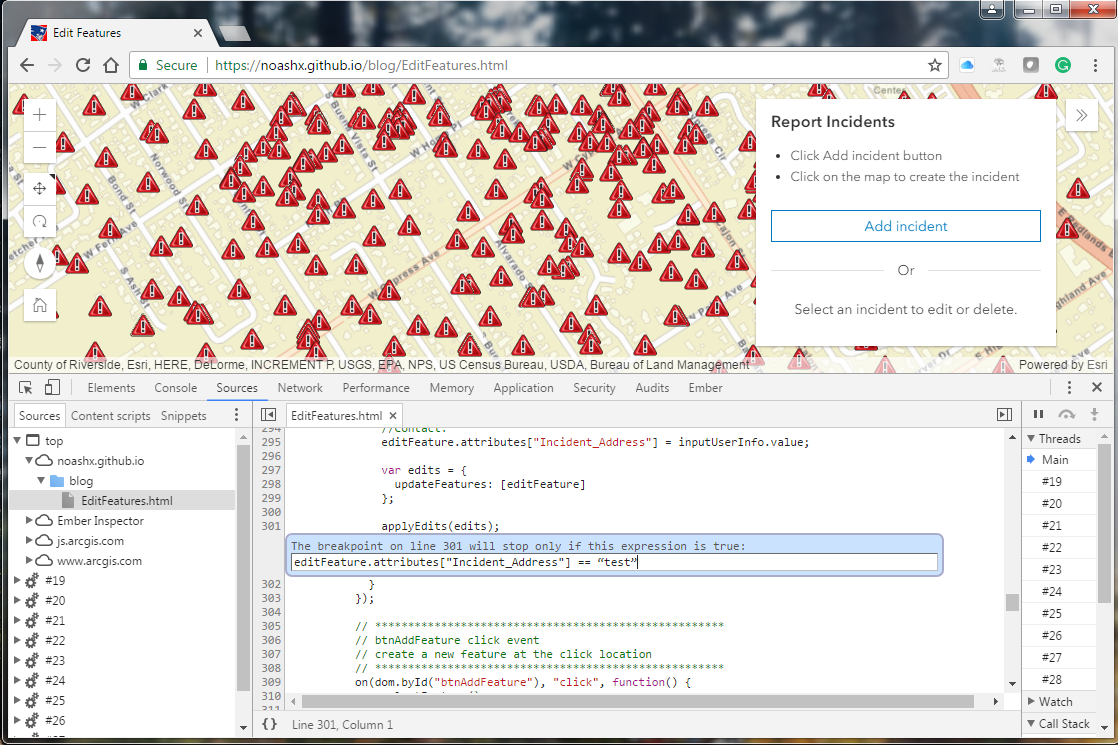
5. If we input “test” for the “Contact:” and click “Update incident info”, the breakpoint will be reached and the application pauses.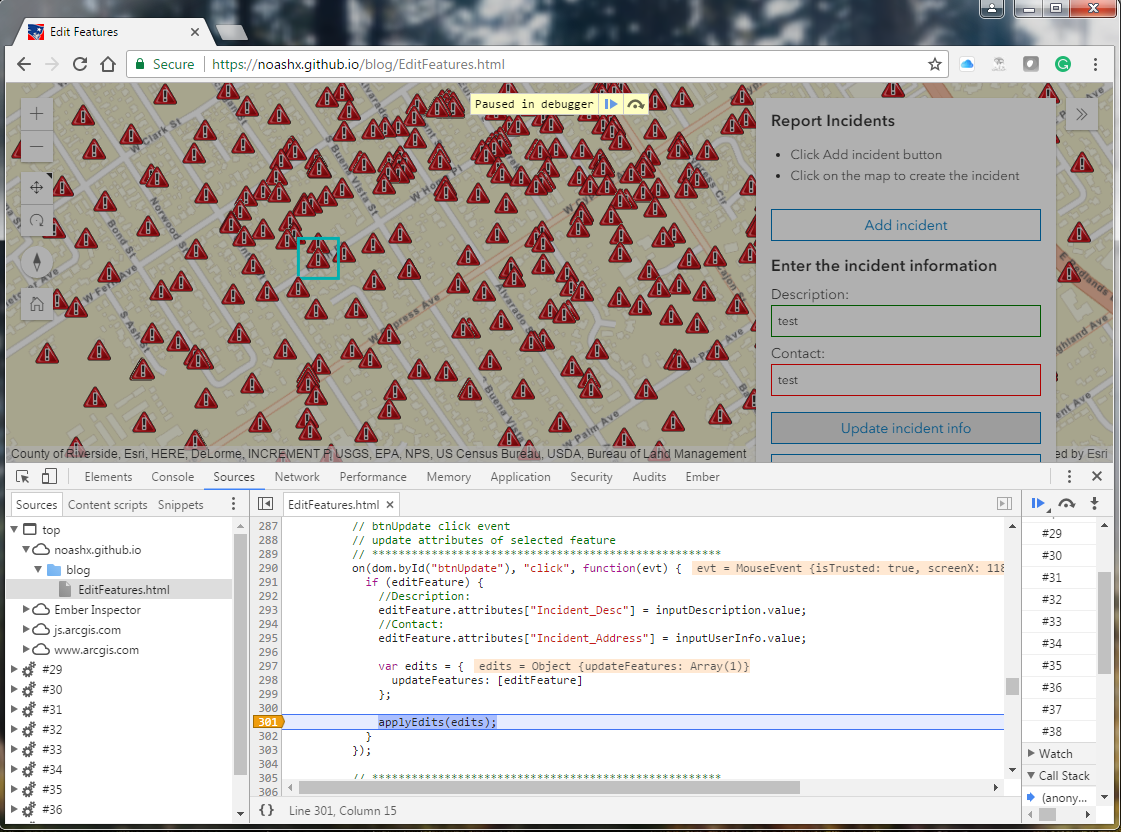
These conditional breakpoints can be useful for testing when you want to ensure data is sent back to the server correctly, or for error handling when you want the application to pause so you can inspect the object(s) of interest rather than letting your error handling code take over.Part 3: Blackboxing
While setting breakpoints is a great way to make friends and go through your code, this process can occasionally kick you out of the file of interest and into another source file or into a third-party JavaScript library.
For example, let’s look at a sample.
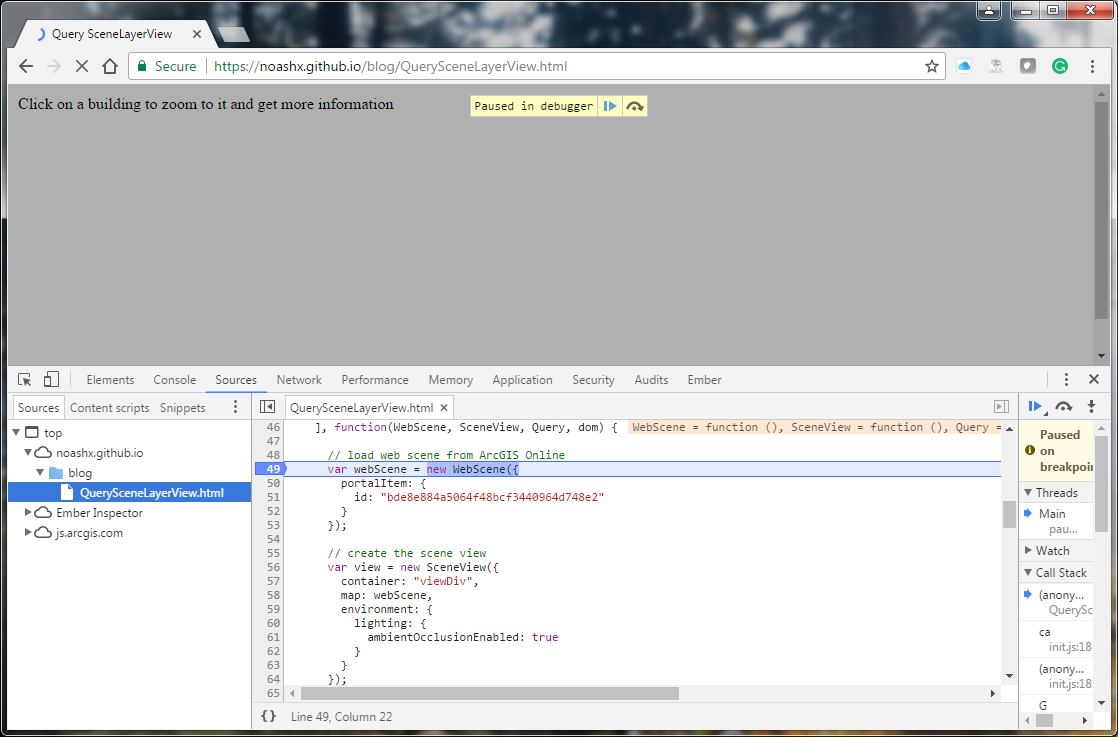
1. Open the Query SceneLayerView sample to follow along (this is similar to the sample found on developers.arcgis.com).
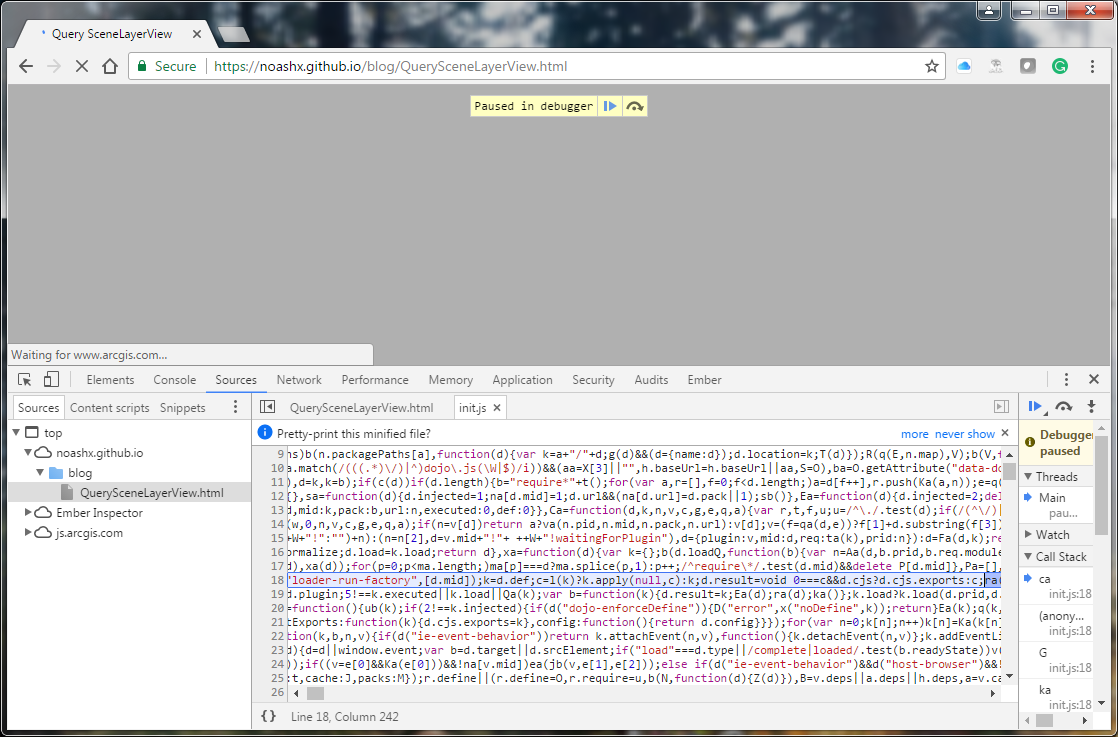
2. Open the Chrome Developer Tools, select the Sources tab, and left-click line 49 to set a breakpoint.
3. Refresh the page so the debugger pauses on line 49. From here, a "Paused in debugger" message appears (next to a "Play" button and a "Step Over" button). See below for a screenshot.
4. If you click the "Step Over" button about five times, you exit out of the main .html file and into the init.js file of the ArcGIS API for JavaScript. You can explore the init.js file, but we want to focus on the code that we wrote. Click the "Play" button to get home safely.
Enter blackboxing to save the day. Blackboxing is a method to exclude files and libraries from the debugger, so that your focus remains on your file(s) of interest. Let’s take a look at how we can blackbox the ArcGIS API for JavaScript library so we can just step through the main file of interest.
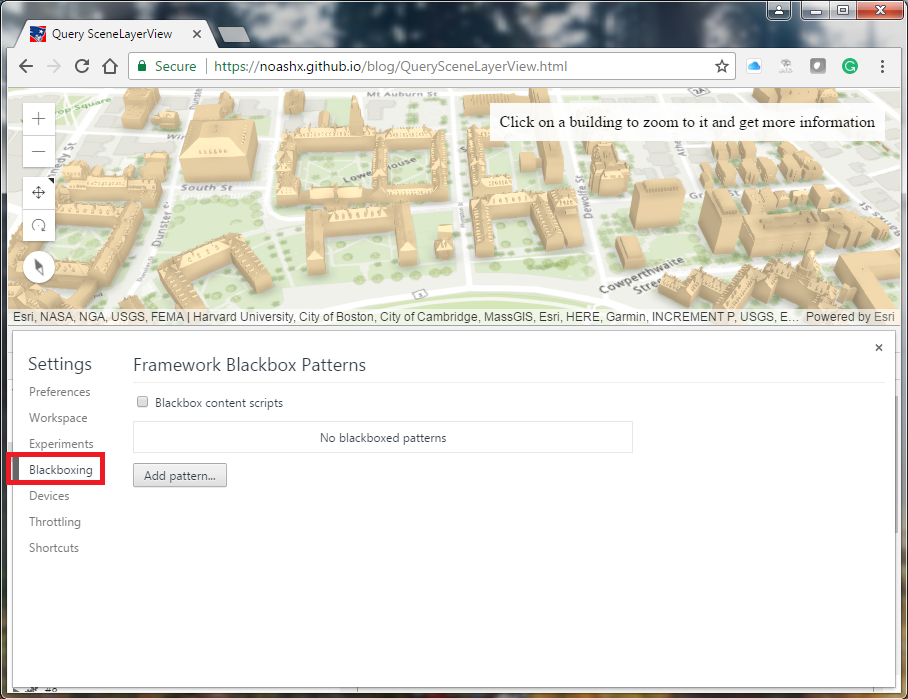
1. With the Developer Tools open, click the three vertical dots in the far right-hand pane of the window and select Settings.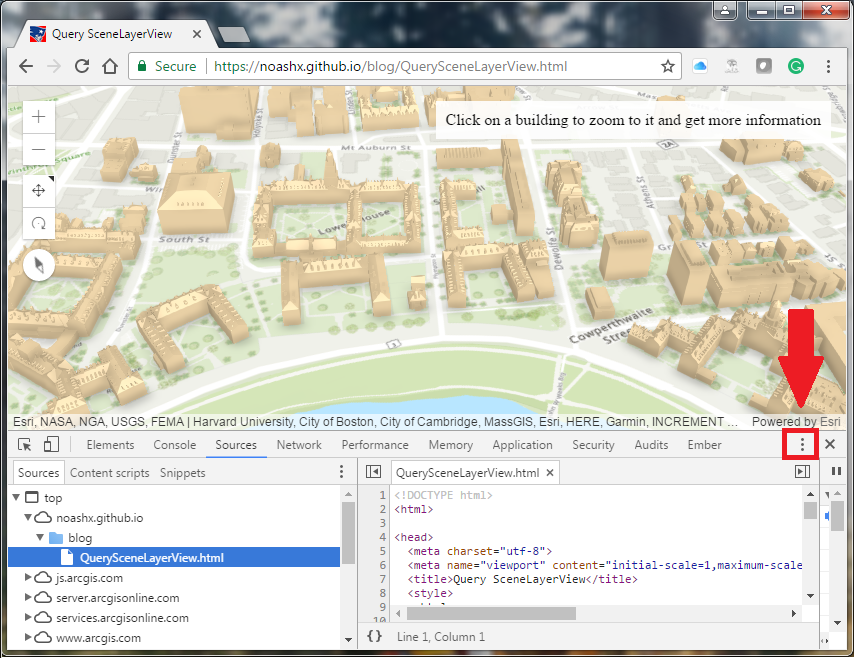
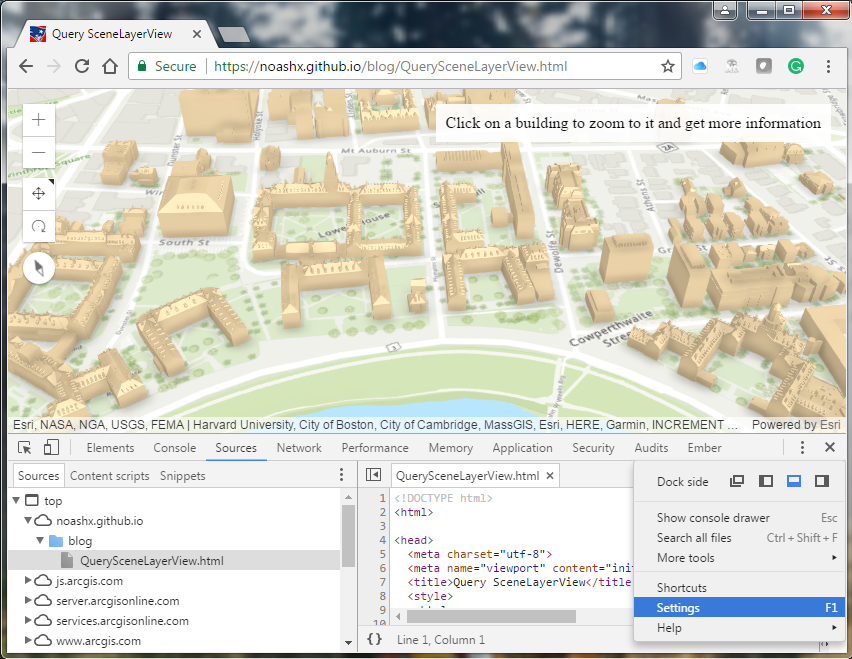
2. On the left-hand side of the window, click “Blackboxing” to open the “Framework Blackbox Patterns”.
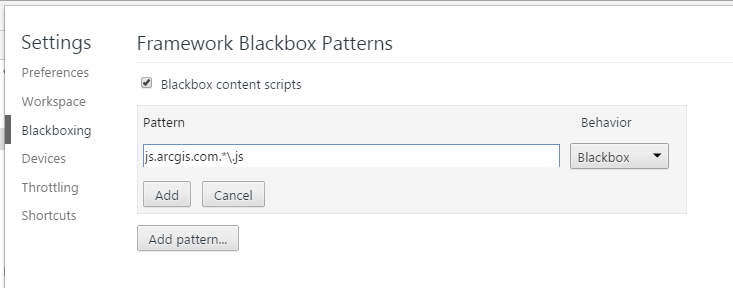
3. Click the “Add pattern…” button, and enter this framework pattern: js.arcgis.com.*\.js
4. Click “Add” and check the box above the pattern input to “Blackbox content scripts”.
5. Close the Settings window and return to the Sources tab.
6. Refresh the page so the debugger pauses on line 49.
7. If you click the "Step Over" button about five times, you exit out of the main .html file and into the debugger:///VM file (this is an empty function which you can safely ignore, or read more about here), as well as complete one more "Step Over" operation into the application. Now rather than debugging unnecessary, ancillary libraries, you can focus on debugging the code you wrote or are trying to understand.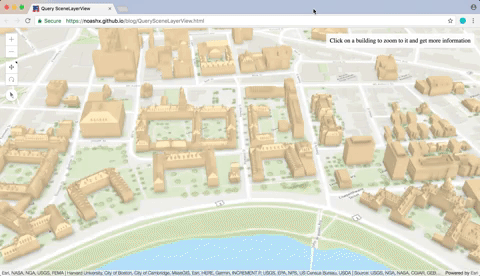
One last point worth mentioning is that blackboxing applies to the browser, not just to the webpage or web app of interest. After testing completes, feel free to remove the blackboxed pattern(s) to ensure a conventional web browsing experience.
This concludes our blog about advanced tips for using the Google Chrome Developer Tools with examples from the ArcGIS API for JavaScript. We hope you found the above tips useful and entertaining. For more information about debugging tips with JavaScript applications, here are a couple additional resources from the past several years:Additional Resources
Artemis F. and Noah S. - Esri SDK Support
In the past two JavaScript Debugging Tips posts on the Esri Support blog, we looked at the Network Tab and the Console Tab as part of the Google Chrome Developer Tools. While most modern browsers have some form of developer tools, here we use Chrome for our examples.
Our goal for this third blog post in the series is to introduce more advanced tips and tricks to enable you to more effectively debug and troubleshoot your JavaScript code. Specifically, we will focus on three areas: enhanced messaging to the console, better ways to set breakpoints using conditions specified at runtime, and a more efficient way of stepping through breakpoints in the Sources tab with a method called blackboxing.Part 1: Console.table
Console.log is our primary debugging function, but this function's output can be a bit difficult to read (especially when viewing a lot of data). One way to enhance our console log messaging and view data more easily is to display a list of objects as a table, which is accomplished using the console.table function. This function takes one mandatory argument, which must be an array or an object, and one additional optional parameter. Each element in the array is a row in the table.
Let’s take a look at the Console Table sample.
1. Open the Chrome Developer Tools by using shortcut keys (Windows: Control + Shift + I, and Mac: Command + Option + I), or by navigating to the top right-hand pane of the browser, clicking the three grey vertical dots, and choosing “More tools” > “Developer tools”.
2. Select the console tab.
3. Click “Perform Query” in the sample application. This performs a query task to view all counties in Connecticut. The code uses the console.table to print the results in a table as shown below.

console.table
Every row in the table shows all attributes for a specific county. Next, we use the console.log to compare the console.log and console.table. This function will print a line with an array of objects.
console.log
Once we expand the array, we can view the objects in a list.

console.log expanded
To view the attributes, we must expand the objects in the list.

console.log expanded with attributes

console.table & console.log
In JavaScript Debugging Tips Part II, we talked about setting a breakpoint in the Sources tab, refreshing the application, and pausing the application at that line of code. This is a great way to examine your code and how functions are called, and where potential areas of trouble could arise.
However, sometimes we don’t want the breakpoint to be reached every time. Sometimes we only want the breakpoint to be reached if certain conditions are met. While we could write some logic code in the form of a loop to check for values, there is an easier way to do this at runtime.
For example, let’s look at a sample.
1. Open the Edit Features sample and the Chrome Developer Tools.
2. Navigate to the Sources tab, and left-click line 301 to set a breakpoint there.
3. After the breakpoint is set, right-click the breakpoint and select “Edit breakpoint…”.

Edit Breakpoint

Add Conditional Breakpoint
4. Set a condition whereby the breakpoint will be reached only if the user inputs “test” into the “Contact:” field when updating a feature. Here is the code: editFeature.attributes["Incident_Address"] == “test”Note: We do not want to use "=" because this assigns a value and thus always returns true, so we must use "==".

Breakpoint Expression
5. If we input “test” for the “Contact:” and click “Update incident info”, the breakpoint will be reached and the application pauses.

Condition Met
These conditional breakpoints can be useful for testing when you want to ensure data is sent back to the server correctly, or for error handling when you want the application to pause so you can inspect the object(s) of interest rather than letting your error handling code take over.Part 3: Blackboxing
While setting breakpoints is a great way to make friends and go through your code, this process can occasionally kick you out of the file of interest and into another source file or into a third-party JavaScript library.
For example, let’s look at a sample.
1. Open the Query SceneLayerView sample to follow along (this is similar to the sample found on developers.arcgis.com).
2. Open the Chrome Developer Tools, select the Sources tab, and left-click line 49 to set a breakpoint.
3. Refresh the page so the debugger pauses on line 49. From here, a "Paused in debugger" message appears (next to a "Play" button and a "Step Over" button). See below for a screenshot.

Paused At Line 49
4. If you click the "Step Over" button about five times, you exit out of the main .html file and into the init.js file of the ArcGIS API for JavaScript. You can explore the init.js file, but we want to focus on the code that we wrote. Click the "Play" button to get home safely.

Debugger in init.js file
Enter blackboxing to save the day. Blackboxing is a method to exclude files and libraries from the debugger, so that your focus remains on your file(s) of interest. Let’s take a look at how we can blackbox the ArcGIS API for JavaScript library so we can just step through the main file of interest.
1. With the Developer Tools open, click the three vertical dots in the far right-hand pane of the window and select Settings.

Developer Tool Settings

Developer Tool Settings
2. On the left-hand side of the window, click “Blackboxing” to open the “Framework Blackbox Patterns”.

Blackboxing
3. Click the “Add pattern…” button, and enter this framework pattern: js.arcgis.com.*\.js

Blackboxing Pattern
4. Click “Add” and check the box above the pattern input to “Blackbox content scripts”.
5. Close the Settings window and return to the Sources tab.
6. Refresh the page so the debugger pauses on line 49.
7. If you click the "Step Over" button about five times, you exit out of the main .html file and into the debugger:///VM file (this is an empty function which you can safely ignore, or read more about here), as well as complete one more "Step Over" operation into the application. Now rather than debugging unnecessary, ancillary libraries, you can focus on debugging the code you wrote or are trying to understand.

One last point worth mentioning is that blackboxing applies to the browser, not just to the webpage or web app of interest. After testing completes, feel free to remove the blackboxed pattern(s) to ensure a conventional web browsing experience.
This concludes our blog about advanced tips for using the Google Chrome Developer Tools with examples from the ArcGIS API for JavaScript. We hope you found the above tips useful and entertaining. For more information about debugging tips with JavaScript applications, here are a couple additional resources from the past several years:Additional Resources
- Useful Javascript debugging tips you might not know (2015)
- Javascript debugging tips using the Chrome Dev Tools, deb.js and more (2015)
- (Mozilla) Introducing debugger.html (2016)
- Debugging with the JavaScript debugger (2017)
- Blackbox JavaScript Source Files
Join us next time as we continue to delve ever deeper into Developer Tools and learn some valuable lessons. Happy debugging!</span>
Artemis F. and Noah S. - Esri SDK Support
Labels
1 Comment
You must be a registered user to add a comment. If you've already registered, sign in. Otherwise, register and sign in.
About the Author
Noah Sager is a Senior Product Engineer on the ArcGIS Maps SDK for JavaScript team at Esri. He specializes in labeling, routing, printing, and maybe more. Prior to joining Esri, he mapped utility lines around Appalachia, investigated public restroom access in Chicago, and studied foraging behavior in squirrels in Canada.
Labels
-
Announcements
70 -
ArcGIS Desktop
87 -
ArcGIS Enterprise
43 -
ArcGIS Mobile
7 -
ArcGIS Online
21 -
ArcGIS Pro
14 -
ArcPad
4 -
ArcSDE
16 -
CityEngine
9 -
Geodatabase
25 -
High Priority
9 -
Location Analytics
4 -
People
3 -
Raster
17 -
SDK
29 -
Support
3 -
Support.Esri.com
60
- « Previous
- Next »