Turn on suggestions
Auto-suggest helps you quickly narrow down your search results by suggesting possible matches as you type.
Cancel
- Home
- :
- All Communities
- :
- Services
- :
- Esri Technical Support
- :
- Esri Technical Support Blog
- :
- Putting ArcGIS Server JavaScript API Graphics to w...
Putting ArcGIS Server JavaScript API Graphics to work
Subscribe
589
0
09-04-2009 12:20 PM
by
Anonymous User
Not applicable
0
0
589
- Subscribe to RSS Feed
- Mark as New
- Mark as Read
- Bookmark
- Subscribe
- Printer Friendly Page
09-04-2009
12:20 PM

HI, this is Jamie P. bringing you another post geared towards our developer community.
ArcGIS Server's JavaScript API provides a Graphic object that takes multiple Geometry types for overlaying custom graphics on the Map. Three basic types of Geometry are provided: Point, Polyline, and Polygon. How the graphics are drawn is dependant on the symbol assigned to the Graphic. Graphics don't always need to be static.
Making the Graphics work can easily be accomplished by adding or removing geometries from the Graphics object. Geometry manipulation of the Graphic object provides an appearance of graphical animation.
Below is a JavaScript example of creating a line that has the appearance of a tracking layer. The setInterval function call sets a timer to call the buildLine function based on the duration specified in the second parameter passed. The addGraphic function creates the initial point Graphic. The buildLine function adds additional point Graphics to keep extending the line Graphic.
setInterval(buildLine, 1000);
function init() {
map = new esri.Map("map");
dojo.connect(map, "onLoad", addGraphic);
var tiledMapServiceLayer =
new esri.layers.ArcGISTiledMapServiceLayer(
"http://brownduck/arcgis/rest/services/UtahEnergyTiled/MapServer");
map.addLayer(tiledMapServiceLayer);
}
function addGraphic() {
xcoord = 324299.8395;
ycoord = 4460178.869;
startPoint = new esri.geometry.Point(xcoord, ycoord, map.spatialReference);
var symbol =
new esri.symbol.SimpleMarkerSymbol(esri.symbol.SimpleMarkerSymbol.STYLE_CIRCLE,
5, new esri.symbol.SimpleLineSymbol(esri.symbol.SimpleLineSymbol.STYLE_SOLID,
new dojo.Color([255,0,0]), 5), new dojo.Color([255,0,0,0.25]));
map.graphics.add(new esri.Graphic(startPoint, symbol));
}
function buildLine(){
var i = 1;
var polyLine;
var symbol;
if(i < 2){
var points = new Array();
points[0] = startPoint;
polyLine = new esri.geometry.Polyline(map.spatialReference);
symbol =
new esri.symbol.SimpleLineSymbol(
esri.symbol.SimpleLineSymbol.STYLE_SOLID, new dojo.Color([255,0,0]), 5)
}xcoord = xcoord + 1000.0000;
ycoord = ycoord + 0.0000;
var addPoint = new esri.geometry.Point(xcoord, ycoord, map.spatialReference);
points = addPoint;
polyLine.addPath(points);
map.graphics.add(new esri.Graphic(polyLine, symbol));
i = i + 1;
}
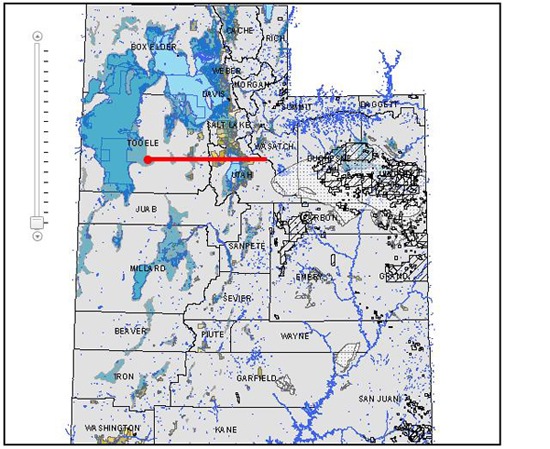
The image below shows the outcome of the code above. Notice the start point to the far left of the drawn line. The start point Graphic may be enhanced by applying a different symbol to the Graphic.
-Jamie P., Support Analyst, SDK Group, ESRI Support Services
You must be a registered user to add a comment. If you've already registered, sign in. Otherwise, register and sign in.
Labels
-
Announcements
70 -
ArcGIS Desktop
87 -
ArcGIS Enterprise
43 -
ArcGIS Mobile
7 -
ArcGIS Online
22 -
ArcGIS Pro
14 -
ArcPad
4 -
ArcSDE
16 -
CityEngine
9 -
Geodatabase
25 -
High Priority
9 -
Location Analytics
4 -
People
3 -
Raster
17 -
SDK
29 -
Support
3 -
Support.Esri.com
60
- « Previous
- Next »