- Home
- :
- All Communities
- :
- Services
- :
- Implementing ArcGIS
- :
- Implementing ArcGIS Blog
- :
- System Log Parser - Statistics and Service Optimiz...
System Log Parser - Statistics and Service Optimization
- Subscribe to RSS Feed
- Mark as New
- Mark as Read
- Bookmark
- Subscribe
- Printer Friendly Page
What is System Log Parser?
System Log Parser is an ArcGIS for Server (10.1+) log query and analyzer tool to help you quickly quantify the "GIS" in your deployment. When run, it connects to an ArcGIS for Server instance on port 6080/6443/443 as a publisher (or an administrator), retrieves the logs from a time duration (specified as an input), analyzes the information then produces a spreadsheet version of the data that summarizes the service statistics. The command-line version of System Log Parser (slp.exe) is used by ArcGIS Monitor for data capture.
Note: This post is a second in a series on System Log Parser, please see ArcGIS Server Tuning and Optimization with System Log Parser to learn how to setup your server for System Log Parser and an overview of the report.
Introduction to Statistics Used In System Log Parser
There are several statistical categories you should be familiar with when using System Log Parser. (definitions from Wikipedia)
Percentile (P) - a measure used in statistics indicating the value below which a given percentage of observations in a group of observations falls. For example, the 20th percentile is the value (or score) below which 20% of the observations may be found.
Average (avg) - is a single number taken as representative of a list of numbers. Different concepts of average are used in different contexts. Often "average" refers to the arithmetic mean, the sum of the numbers divided by how many numbers are being averaged. In statistics, mean, median, and mode are all known as measures of central tendency, and in colloquial usage, any of these might be called an average value.
Maximum (Max) - the largest value of the function within a given range.
Minimum (Min) - the smallest value of the function within a given range.
Standard Deviation (Stdev) - measure that is used to quantify the amount of variation or dispersion of a set of data values. A l...
Fields of the Statistics Collected
Field
Definition
| Resource | Requested resource or service (Service REST endpoint) |
| Capability | The ArcGIS capability of the resource |
| Method | The function performed by the resource (What was accessed) |
| Count | The number of requests for this resource |
| Count Pct | Count percentage based on total service requests |
| Avg | The average time (in seconds) spent processing request |
| Min | The time (in seconds) of the shortest request |
| P5, P25, P50, P75 | The percentile grouping of the time (in seconds) |
| P95 | 95% of all responses occur between 0 seconds and the value displayed in this column per service |
| P99 | 99% of all responses occur between 0 seconds and the value displayed in this column per service |
| Max | The time (in seconds) of the longest request |
| Stdev | The standard deviation of time (in seconds) |
| Sum | The total time (in seconds) spent processing requests per resource |
| Sum Pct | The total time (in seconds) spent processing requests |
We're going to focus on 2 key statistics, P95 and Max. As we learned above, P95 signifies the response time for the fastest 95% of all requests and Max signifies the maximum draw time per request per service and method.
Identifying Opportunities to Tune Service Performance
In the example below, I've sorted P95 and Max values over 1/2 second. User experience drops the longer your draw-time takes.
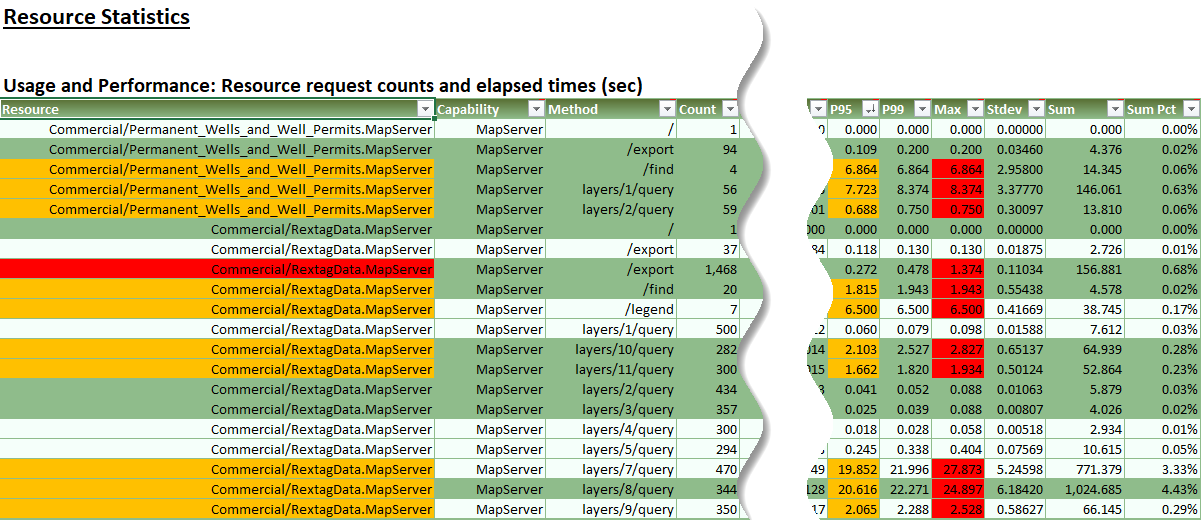
I've highlighted any Max draw time over 1/2 second in red and any P95 draw time over 1/2 second in yellow. These are the services and layers I'd focus on cleaning up, focusing first on getting the P95 value below 1/2 second first.
In the next section you'll find starting points to tune and optimize your services.
Another column worth reviewing is the Sum Pct. this column factors in the number of requests for each service and the respective average time, then weights that in against all the other services.
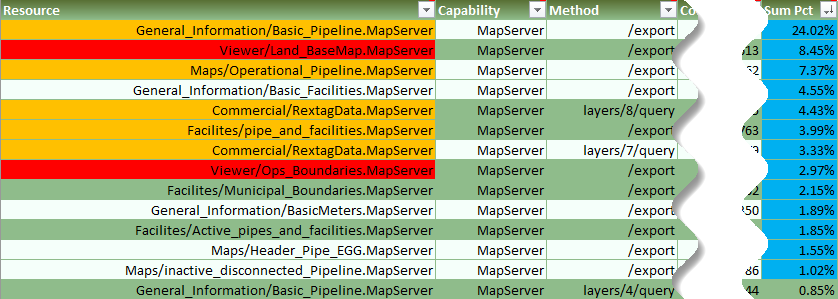
For example:
- One service may have thousands of more requests than all others but it has fast times (Sum Pct should be low)
- Another service may have just a small handful of requests but very slow times (Sum Pct should be high). In this case, this service would be a good candidate to for tuning.
Best Practices for Services
Below are some links to get you started on service tuning and SOC management.
- Tune and Configure Services
- Tune Services Using Best Practices
- Shared and Dedicated Instances
- Server Software Performance (GIS Wiki)
- ArcGIS Enterprise: Performance and Scalability Best Practices
In addition to the above, data source performance should be looked at if adjustments to the service do not help enough. You can look at:
- Geodatabase Design Steps
- Increasing the Frequency of Updating Statistics on Tables
- Rebuilding Index Tables
- Proper Parent-Child Version Design
- Database Compression
- Monitor the Database
I hope you find this helpful, do not hesitate to post your questions here: https://community.esri.com/thread/231451-arcgis-architecture-series-tools-of-an-architect
Note: The contents presented above are recommendations that will typically improve performance for many scenarios. However, in some cases, these recommendations may not produce better performance results, in which case, additional performance testing and system configuration modifications may be needed.
You must be a registered user to add a comment. If you've already registered, sign in. Otherwise, register and sign in.