Implementing ArcGIS Blog - Page 10

cancel
Showing results for 
Show  only  | Search instead for 
Did you mean: 

Latest Activity

(183 Posts)
by Anonymous User
Not applicable

Organizations who establish and take action through a Geospatial Strategy, raise the profile of GIS and geospatial technologies in their organization. Taking a business first approach is key. Creating a business-oriented plan, considering people, process, and technology, defining how an organization will use GIS to achieve goals, outcomes, and overcome challenges. There are many opportunities to learn more about this concept at UC. My colleagues and I will be sharing our experiences and advice through workshops, 1-1 activities, and an inaugural Geospatial Strategy panel!

You can find me and my colleagues at UC:

Technical Workshops

Tuesday, July 9                                                                                                         Location: SDCC - Rooms

1:00 pm

Introduction to Geospatial Strategy

SDCC, Room 17 B

Wednesday, July 10                                                                                         Location: SDCC - Rooms

10:00 am

Introduction to Geospatial Strategy

SDCC, Room 31 A


Thursday, July 11                                                                                             Location: SDCC - Rooms

1:00 pm

Geospatial Strategy Panel Session

SDCC, Room 16 B


Spotlight Talks                               

Tuesday, July 9                             Location: Expo: Guiding Your Geospatial Journey Spotlight Theater      

10:00 am

Introduction to Geospatial Strategy


12:15 pm

Prioritizing Activities: Where to Start


5:15 pm

Evangelizing GIS in your Organization


Appointments                                                                           

Tuesday, July 9 – Thursday, July 11  Location: SDCC – Expo: Guiding Your Geospatial Journey Area                                              

What’s Your Geospatial Strategy?

Review where you are today with an expert on geospatial strategy and discuss how a strategy can help you meet organizational goals. Leave with a set of initial recommendations based on the elements of a geospatial strategy.

Schedule an appointment


Expo Area

Stop by to connect 1-on-1 with Esri Staff and talk more about Geospatial Strategy
in our Guiding Your Geospatial Journey area.

Tuesday, July 9                9:00 AM–6:00 PM

Wednesday, July 10         9:00 AM–6:00 PM

Thursday, July 11             9:00 AM–4:00 PM

geospatialstrategy esri esriservices implementingarcgis‌strategyandplanning‌

more
3 0 732
by Anonymous User
Not applicable

Isn’t life all about people? People are responsible for successful or failed relationships, processes, plans, getting things done, and changing the trajectory of history. It’s no different in an organization – people are the critical piece of a well-executed geospatial strategy. So, if you focus on a strategy for educating, developing, growing, and nurturing those people in your organization, then it all flows from there.
My colleagues and I are excited to be at UC, sharing from our experience helping Esri users with their people strategy – we'd love to connect with you – you'll find us in all these places:  

Technical Workshops

Wednesday, July 10                                                                                        Location: SDCC - Rooms

8:30 am

Get the C-Suite’s Attention with Strategic Workforce Planning

SDCC, Room 31 A

1:00 pm

Increase GIS Adoption the Agile Way

SDCC, Ballroom 06 F

2:30 pm

Workforce Development Planning in Three Simple Steps

SDCC, Ballroom 06 F

Spotlight Talks                                               

Tuesday, July9                             Location: SDCC – Expo: Guiding Your Geospatial Journey Spotlight Theater      

10:30 am

Making It Real: Use Training to Make Your Tech Dreams Come True


Wednesday, July 10                         Location: SDCC – Expo: Guiding Your Geospatial Journey Spotlight Theater      

1:00 pm

Advance Your Goals with Esri Technical Certification


4:00 pm

Focus on Training to Go the Distance


Appointments         

Tuesday, July 9 – Thursday, July 11 Location: SDCC – Expo: Guiding Your Geospatial Journey Spotlight Theater                                             

Workforce Development Planning

Our training consultants will help you devise a strategy-driven learning plan that will ensure that your workforce has the skills to leverage ArcGIS. Leave with a high-level plan and strong justification to develop your workforce.   

Schedule an appointment

Expo Area

Stop by to connect 1-on-1 with Esri Staff and talk more about People Strategy
in our Guiding Your Geospatial Journey area.

Tuesday, July 9                9:00 AM–6:00 PM

Wednesday, July 10         9:00 AM–6:00 PM

Thursday, July 11             9:00 AM–4:00 PM

more
4 0 692
AdamCarnow
Esri Regular Contributor

Return on Investment, commonly abbreviated as ROI, is an important goal for any GIS project that should be calculated, documented, and shared.  Check out this Story Map to learn more about GIS ROI and view many real-world examples.

https://arcg.is/1Wi0CO 

more
2 1 1,332
AdamCarnow
Esri Regular Contributor

If you're headed to the 2019 Esri International User Conference and are interested in sessions for GIS Managers, here is a link to the GIS Manager Track:

https://userconference2019.schedule.esri.com/schedule?filters=1964269831

more
0 0 519
AdamCarnow
Esri Regular Contributor

Are you a GIS manager, leader or other executive headed to the 2019 Esri International User Conference (UC)?  I know it can be a challenge creating your personal agenda for the world's largest GIS conference, so I created this flier to assist.  It covers suggested events and activities you should consider when deciding how to spend your valuable time at UC.  I hope you have a productive UC experience, and I hope to see you there!

UPDATED 6/24/2019 - Added GIS Manager Track and Get Advice from Esri Services section.

UPDATED 6/13/2019 - Corrected the name of the Implementing ArcGIS area in the Expo to “Guiding your Geospatial Journey”

FYI there are other Esri UC fliers here: https://community.esri.com/community/events/user-conference/content?filterID=contentstatus%5Bpublish...

more
3 0 2,354
AhmadAbdallah
Esri Contributor

Introduction

To cloud or not to cloud is the question that many organizations are currently facing. While on-premise data center technology is not necessarily on the verge of extinction, cloud computing is an option with many benefits including scalability, agility and cost efficiency.

The ArcGIS platform is supported on both on-premises or in a cloud environment like Microsoft Azure or Amazon Web Services (AWS). By leveraging these components, you can expose GIS content and capabilities as web services and consume those services in your apps. This enables users to access and apply useful GIS resources in their work.

Moving to the cloud is more than just upgrading your servers and software. It represents a radical change in the way that you manage technology. This shift gives you a unique opportunity to align technology with your overall business vision, which in turn can help you grow your business, improve productivity, and reduce costs.

Before starting, it is a must to document your current infrastructure, this includes compiling a list of your servers, storage systems, network components, off the shelf software, bespoke software, and subscriptions to gain a full picture of your current technology. This information is critical for helping you determine the best path forward.

Analyzing your current infrastructure against your user workflows is the next step.  From assessing your desktop workflows to assessing your integrations, your security policies, SLAs, data storage requirements, authorization, and authentication providers all these points will play a huge factor in designing your cloud infrastructure. We will discuss these topics briefly in this article and will go into the specifics of each separately in future blogs posts.


General Database Considerations

Moving your Geodatabase to the cloud is a big step, you need to consider where your clients accessing the data exist, are they running from the cloud or on-premise, and what is the type of work is being performed (read-only, frequent edits, etc.).


General Network Bandwidth and Speed

Moving all the infrastructure to the cloud will need a resilient and reliable Internet connection, most importantly with low latency. Low bandwidth can be a serious problem when you factor in a large number of employees sharing the same network. Sometimes cloud solutions don’t offer enough bandwidth, especially when it comes to uploading larger files such as raw satellite imagery. However, latency is the primary concern as network latency is the key factor in determining cloud architecture decisions, for example, because of the latency it is likely not practical to keep desktops on premise and move the database into the cloud.


Assessing ArcGIS Desktop Workflows

First and Foremost, do you need to provide this functionality through ArcGIS Pro or ArcGIS Desktop, or can we have it replaced via a web-based app? That would save us setting up a dedicated machine or application instance on the cloud.

Is the data you are processing 2D or 3D? ArcGIS Pro required a GPU and the resourcces are even more demanding if processing 3D data. GPU enabled machines on the cloud cost considerably more than machines without a GPU. Do you have advanced Geoprocessing workflows that require hefty computing power, do these workflows run overnight? Check out https://pro.arcgis.com/en/pro-app/get-started/virtualization-overview.htm for more information about running ArcGIS Pro on the cloud.


ArcGIS Server Sites and Portal for ArcGIS Sites

The least difficult method for starting to use the cloud for hosting your own software is perform a lift-and-shift migration, where you move software currently running on-premises to the cloud host. The behavior of the software is precisely the same after moving into the cloud however now it is running with the benefits of underlying cloud infrastructure, such as having affordable and reliable virtual machines that don’t require high upfront purchasing costs and little ongoing maintenance of the infrastructure.

Using specialized deployment tools can make it easier to install and configure the software on certain cloud platforms. You can also create your own machine images to host Esri software in cloud environments. These deployment tools don’t just install and configure the software; they also provision and set up the underlying infrastructure, including the virtual machines, load balancers, networking, and storage.


Bespoke GIS Applications

Whether you have Geocentric applications, Geo-enabled applications, or Composite applications you will need to reassess the architecture of these applications and ensure the compatibility with the new cloud environment. check out developers.arcgis.com for information about our wide coverage of SDKs and APIs.

No single application integration pattern fits all situations. You can use the application pattern that best combines capabilities from ArcGIS and your business system to deliver the greatest impact.


Integration to Other Systems

Application integration lets you deliver solutions that combine data and tools from different systems—including your GIS as well as business systems like permitting, licensing, and asset management systems. With integrated solutions, you can improve cross-functional business processes and provide decision-makers with integrated views of your organization’s information. Insuring that these systems integrate prevents information duplication and enables having the right data available when you need it. You need the option of deploying your integration technology so that it works in both environments. To decide whether your integration technology will reside in the cloud or in a rack in your data center, you have to start with the specific requirements of your business.


Security

Security is not only an important decision to avoid becoming a statistic, but also one that may be government regulated. Depending on your industry, market, and location, you may have to abide by an array of rules determining how you use and store sensitive data. Cloud security has come a long way, though, and is arguably as secure as most private data centers. In either case, security and regulations of your industry are something to think about when considering cloud and on-premise. With either option, security is granularity configurable to meet your security needs. Consider Esri best practices for configuring secure ArcGIS Server and Portal for ArcGIS environments as well as your organization's needs and policies when designing your ArcGIS Enterprise site security.


High Availability and Redundancy

Designing the HA environments in Azure or AWS are somewhat the same design principles as of on-premises however more functionality is provided by cloud providers such as scalability on demand. You can configure your site so that ArcGIS Server machines are added in response to certain triggers, such as CPU usage. New servers can be created in a matter of minutes, allowing your site to gracefully respond to abrupt spikes in traffic. When you no longer need the instances, you can destroy them and incur no further infrastructure charges for them. The installation is much easier as now there are images already provided for faster installation times.


Backups and Disaster Recovery

Cloud computing has led to a new way of preparing for IT disasters by providing secondary environments for backing up and restoring data and failing over business applications. These disaster recovery services are cost-effective and straightforward to set up. ArcGIS Server and Portal for ArcGIS include utilities that you can use to create backups and restore your sites on Azure and AWS.


Access Management Providers

When implementing a cloud-based application it can be a challenge to ensure that information security and access management controls are applied to the cloud application.

Organizations should ensure that the single sign-on (SSO) access management is implemented in the cloud. In particular, organizations need to understand how employees can seamlessly access the various cloud-based applications using their existing access management protocol.

Portal for ArcGIS is compliant with SAML 2.0 and integrates with identity providers that support SAML 2 Web Single Sign-On. The advantage of setting up SAML is that you do not need to create additional logins for users to access your ArcGIS Enterprise portal; instead, they use the login that is already set up in an enterprise identity store. For example, Microsoft Azure Active Directory is a SAML-compliant identity provider. You can configure it as your identity provider for enterprise logins in Portal for ArcGIS on-premises and in the cloud.

I hope you find this helpful, do not hesitate to post your questions here: - Arcgis Architecture Series : Moving to the Cloud

more
10 0 9,508
AdamCarnow
Esri Regular Contributor

If you want to learn how to redefine yourself from mapmaker to solution provider, I will be presenting The Underutilization of GIS & How To Cure It in a webinar on Tu June 18 at 10AM Pacific:

https://www.esri.com/en-us/landing-page/industry/government/2019/underutilization-of-gis-and-how-to-...

more
4 2 628
DannyKrouk
Esri Contributor

Note: This blog post is the third in the series of three planned posts about egdbhealth.  The first described introduced the tool, how to install it, and how to run it.  The second in the series addressed how to use the tool to evaluate the health of an Enterprise Geodatabase; its primary purpose.  This article addresses using egdbhealth in a system design context.

Introduction

Egdbhealth is a tool for reporting on various characteristics of Enterprise Geodatabases (eGDBes).  The primary purpose of the tool is to evaluate the “health” of eGDBes.  However, the output can also be used in a system design context.  This article addresses the system design use case. 

For information about installing and running the tool, please refer to the first blog post in this series "What is Egdbhealth?"

Information Objectives for System Design

The Esri system design practice focuses on planning the hardware, software, and network characteristics for the future state of systems based on new or changing requirements. 

The current health of an existing system will not necessarily have a strong relationship to a future system that has different requirements.  However, depending on the design objectives, information about the current system can be relevant. 

For example, in the case of a planned migration from an on-premises system to a cloud platform, it would be quite useful to describe the current system such that it can be faithfully rendered on a cloud platform.  Or, requirements driving a design may indicate a need to exchange (replicate, move, synchronize, transform, copy, etc.) large portions of a Geodatabase to another repository.  In that case, an inventory of the Geodatabase content can be useful to establish important details about the nature and quantity of data that would need to be exchanged and the optimal ways for that data exchange to occur. 

Thus, at a high level, it is the primarily the descriptive information from egdbhealth, rather than the evaluative information, which is pertinent to system design.

This article discusses examples for a SQL Server backed eGDB.  However, the principles are the same for eGDBes that are backed by Oracle and PostgreSQL.

Machine Resources and Utilization

For system design cases where the eGDB machine platform will change, it can be useful to understand the current machine resources that support the eGDB and their degree of utilization.  For example, if you are migrating an eGDB to a cloud platform, the number of processor cores that the system has on premises has some relevance to the number you might deploy on the cloud.

The Machine

The HTML metadata file produced by egdbhealth will provide resource information about the machine platform on which the RDBMS runs. 

In the example below, the SQL Server instance runs on a machine with one processor which presents 8 logical processor cores. 

Machine resources in HTML metadata

This information from SQL Server leaves some information unclear.  For example, SQL Server is not able to report on whether the logical cores are a result of hyperthreading.  If they are, then the physical cores would be half of the logical cores (4 physical cores).  And, it is the number of physical cores that is most useful for capacity planning in system design.  So, this information is good but imperfect.

The HTML also reports the physical memory on the machine (16GiB) and the minimum and maximum memory configured for the SQL Server instance (0 and 3GB).  Here we see that the configuration of the SQL Server instance is quite relevant to understanding the relevant memory resources for capacity planning.  Although the machine has 16GiB of memory, this SQL Server instance (and the eGDB it supports) does not have access to all of that memory. 

The Utilization

The characteristics of the machine, and the configuration of the instance, offers incomplete insight into the degree to which the machine resources are utilized and what resources are truly needed for the current workload. 

We can be certain that SQL Server does not use more than 3GB of memory.  But, does it use it thoroughly?  And, what about the processor resources; are the busy or idle?

Much of the utilization information appears in the Expert Excel file because it is relatively volatile.

Processor

In the case of SQL Server, there is an evaluation in the Expert Excel file called “ProcessorUtil” (Processor Utilization; the Category is “Instance”).  It provides a sample of the recent per-minute processor utilization by SQL Server on the machine.  In this case, we can see that, for the sampling period, SQL Server uses almost none of the total processor resources of the machine on which it runs.

Processor utilization

From this, we infer that, if this period is typical, the existing machine has many more processor resources than it needs.  If all else is equal, the future system design can specify fewer processor cores to support the eGDB workload.  Naturally, for this inference to have any integrity, you must run the tool during typical and/or peak workload periods.

There is another evaluation, CpuByDb (Instance category), which reports which databases in the instance consume the most processor resources.  So, in the case that the instance did have significant processor utilization, this information could be used to determine whether that processor utilization related to the eGDB of interest or some other workload in the same SQL Server instance.

Processor utilization by database

Memory

In the case of SQL Server, there are several evaluations which provide insight into the memory utilization inside the instance.  Most of these are in the Instance category of the Expert Excel file.

MemoryByDb allows you to see the amount of memory (in this case, rows of data as opposed to SQL statements or other memory consumption) used by each database.

Memory (database pages) utilization by database

In this case, we see that the “GIS” eGDB is the primary memory consumer in the SQL Server instance.  So, it appears reasonable to understand that the eGDB can make use of the better part of the 3GB of instance memory.  But, is that too much or not enough for good performance and system health?

The MemoryMetrics evaluation reports on several memory metrics that can offer hints about how much in-demand the instance memory is.  In this case, we see that there are warnings that suggest that the existing memory available the instance may be too low for the workload.  Thus, we do not know if 16GiB of machine memory is too much or too little.  But, we do have reason to believe that 3GB of instance memory is too little.

Memory metrics

There are several other memory evaluations in the Expert Excel file.  It takes experience and judgement to integrate these observations into an informed judgement about the true memory needs of the system.   In this case, as in many cases, the inferences that one can make are incomplete.  But, they are better than nothing.

Storage

SQL Server does not provide complete information about the local storage on the machine on which it runs.  However, it does provide information about the size of the files in which the eGDB is stored.  Much of this information is available in the “Database” category of the Expert Excel file.

The FileSpace evaluation sheet reports on the files in which the eGDB is stored.  In this example, we see that there is a single data file (“ROWS”) which is about 6GB in size and a single transaction log file (“LOG”) which has used about 650MB in the past.  You can also see the maximum file limits established by the DBA, presumably being an indication of the maximum expected storage for the eGDB.

Database file sizes

These data are good indications of the amount of storage that would be needed for a “lift and shift” scenario where the entire eGDB will need to move to a different platform.

Data Inventory and Data Exchange

Another system design case is eGDB data needs to be exchanged with a different repository, perhaps another Geodatabase in a different data center.  In these cases, it may be relevant to establish the storage size and other characteristics of the data that will be exchanged, as opposed to the storage size of the entire eGDB.

Record Counts and Storage By ObjectClass

If you know the identity of the ObjectClasses to be exchanged there is information in the Content Excel file to report on the storage size and record counts of those item. 

In the Storage category, there is a sheet called “ObjClass” (ObjectClasses).  It reports, in considerable detail, the tables from which various eGDB ObjectClasses are composed, the number of rows that they contain, and the amount of storage that is allocated to each of them. 

In the example below, there are three ObjectClasses of interest (filtered in the first column): BUILDINGS_NV, COUNTRIES, and SSFITTING.  BUILDINGS_NV has about 4,400 records and consumes just over 1.25MB of space.  COUNTRIES is versioned, with 249 records in the base table, 66 adds, and 5 deletes (the TableName column calls out the “A” and “D” table names for versioned ObjectClasses).

ObjectClass records and storage

Thus, we can establish the record counts and approximate storage characteristics of ObjectClasses of interest in the eGDB.  At the same time, we can also see which ObjectClasses are registered as versioned.  This is critical information for establishing the range of options available for data exchange.

Versioning, Archiving, and Replication Status

In the same Context Excel file, the ObjClassOverview (Inventory category) provides an overview of the versioning, archiving, and replication statuses of all of the ObjectClasses in the eGDB.  This provides a more convenient mechanism for planning the range of data interchange mechanisms that would be appropriate for different ObjectClasses.

ObjectClass overview

Distributed Data Design Consideration

The ArcGIS documentation refers to this thematic area as “distributed data” and offers general guidance about the various strategies that can be used to move data around: http://desktop.arcgis.com/en/arcmap/latest/manage-data/geodatabases/understanding-distributed-data.h....

Versioned Data and Geodatabase Replication

If an ObjectClass is not already registered as versioned it may or may not be appropriate to do so for the purposes of making use of Geodatabase Replication.  This relates to how the data is updated.  Most data that is registered as versioned is updated “transactionally”, meaning that only a small percentage of the total records are changed at any given time.  This kind of updating is compatible both with versioning and Geodatabase Replication.  Other data is updated with methods like “truncate and add”, “delete and replace”, or “copy and paste”.  In these cases, most of the records are updated, physically (even if the majority of record values happen to be the same, the physical records have been replaced).  That kind of updating is not particularly well-suited to Geodatabase Replication.  The information in egdbhealth can tell you about the versioning and replication status of ObjectClasses.  But, it does not know how those ObjectClasses are actually updated.  Hopefully, those that are registered as versioned are transactionally updated and therefore suitable candidates for Geodatabase Replication.

Archiving Data and Data Exchange

If an ObjectClass has archiving enabled, there may be additional considerations.  For example, if the planned data exchange might increase the rate of updates, this could cause the quantity of archive information to grow in ways that are undesirable. 

For versioned ObjectClasses that are archive-enabled, the archive information is stored in a separate “history” table.  The size of that table does not impact the query performance of the versioned data.  In this case, the main design consideration is whether it is practical to persist and use all of the archiving information.  In many cases, it will be.  But, making the determination requires knowing the archiving status of the ObjectClass and the planned rate of updates.

In the case of non-versioned ObjectClasses that are archive-enabled (and branch-versioned ObjectClasses), the archive information is in the main table.  Thus, rapid growth of archive information can change the performance tuning needs of ObjectClasses and/or eGDB.  Egdbhealth cannot know the future update needs for the data.  However, it can report on the historical patterns of updates to non-versioned, archive-enabled ObjectClasses.  The Context Excel file contains a “NvArchEditDatesSql” sheet that contains SQL statements for each non-versioned, archive-enabled ObjectClass in the eGDB.  These statements are not run automatically because they are resource-intensive queries that do not provide information which is relevant to all circumstance. 

Additional SQL statements you can run

In this system design case, however, establishing the rate at which record have accumulated over time may be quite pertinent to planning a data exchange strategy.  Use a SQL client such as SQL Server Management Studio to run the queries for the ObjectClasses in question to get a sense of the rate of data update.  In this example, we can see a pattern for record updates where the typical update is small (1 record), but there was at least one occasion where there was a large update relative to the size of the ObjectClass (289 records on 8 April 2018):

Executed SQL statement

Attachment Size and Mobile Synchronization

Another design case which relates to distributed data is field-based data collection and attachments.  Collector for ArcGIS makes use of efficient mechanisms that are similar to Geodatabase Replication to synchronize “deltas” between client and server.  However, the ability to collect large quantities of data in attachments (such as images) and the often limited network conditions in which the data can be synchronized can raise system design issues.

The Expert Excel file has an evaluation “LargeAttachments” that will automatically bring cases of likely concern to your attention.  In the example below, the threshold values were not violated, so there was no negative evaluation:

There may be no records when there is no negative evaluation

However, it may still be useful to know something about the nature of the existing attachments.  The Context Excel file contains a sheet “AttachmentSizeSql” (“Inventory” category) that contains several SQL statements for each ObjectClass that has attachments. 

Continue to explore with additional SQL statements

Running these SQL statements in a client such as SQL Server Management Studio allows you to statistically characterize the attachments in various ways: aggregate statistics, top 100 by size, and percentile distribution. 

Additional SQL statements executed

With these statistics, you can understand not only the total amount of information, but whether it is due to a large number of small attachments or a small number of large attachments.  Large attachments might be a greater risk for synchronizing over poor network conditions and might lead you to make a recommendation that data collection operate in a disconnected mode and synchronization occur under specific network conditions only.

Attachment size considerations might also lead you to offer recommendations about whether and how it would be practical to handle two-way synchronization (as opposed to one-way).  While field-based users might have sufficient network circumstances to upload the attachments that they collect individually, two-way synchronization would mean that all of the attachments collected by other individuals (in the area of synchronization) would have to be downloaded.  In some cases, this could be many times the amount of information that would need to be uploaded.

Summary

As a designer of GIS systems, it is not practical for you to have profound expertise in all of the technology areas that pertain to the system.  For this reason, your understanding of egdbhealth outputs and what you can do with them has limits.  The purpose of this article is to identify some of the most common use cases for egdbhealth outputs for system design.  The main areas of interest are (1) machine sizing / resource utilization and (2) data characteristics relevant to data interchange.  Following the examples in this article, and generalizing from them for the Oracle and PostgreSQL databases, will allow you to extract useful information from the egdbhealth tool for your design work.

I hope you find this helpful, do not hesitate to post your questions here: https://community.esri.com/thread/231451-arcgis-architecture-series-tools-of-an-architect


Note: The contents presented above are recommendations that will typically improve performance for many scenarios. However, in some cases, these recommendations may not produce better performance results, in which case, additional performance testing and system configuration modifications may be needed.

more
1 0 3,202
DannyKrouk
Esri Contributor

Note: This blog post is the second in a series of three planned posts about egdbhealth.  The first in the series described what the tool is, how to install it, and how to execute it.  The third in the series will address using egdbhealth in a system design context.

Introduction

Egdbhealth is a tool for reporting on various characteristics of Enterprise Geodatabases (eGDBes).  This article discusses how to use the outputs of egdbhealth to evaluate the health of an eGDB.  All of the examples use a SQL Server-backed eGDB.  However, similar principles apply to using the tool with Oracle- and PostgreSQL-backed eGDBes.

For information about installing and running the tool (i.e. creating the outputs), please refer to the first blog post in this series, "What is Egdbhealth?"

Viewing and Understanding Findings

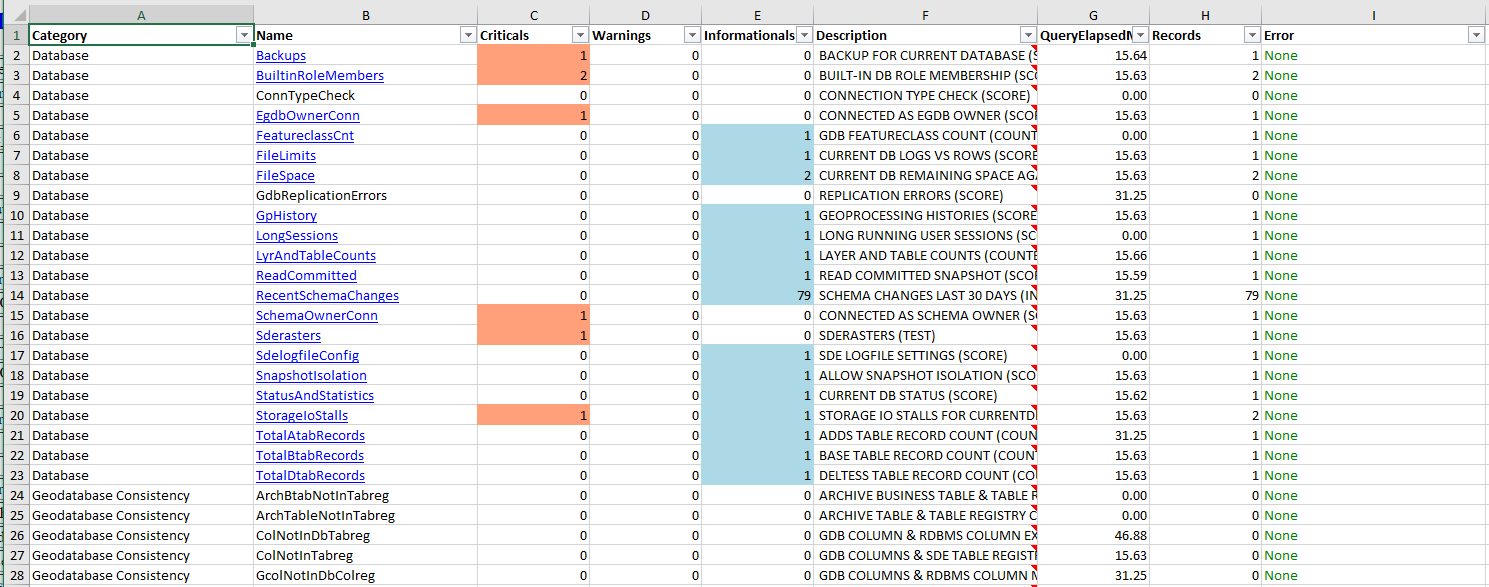
The Expert Excel file contains an “OVERVIEW_EXPERT” sheet that allows you to see the evaluations at a high-level and prioritize your review of the findings.

Expert Excel file Overview sheet

This article will not describe all of the evaluations and their various meanings.  There are too many for that to be practical.  Instead, the article describes the process and provides specific examples to illustrate the kinds of benefits that can be gained.

Criticals

The red-filled cells “Criticals” column should be viewed first.  These findings are highlighted as top concerns in their respective Categories. 

For example, in the screen capture above, “Backups” is flagged as a critical concern.  Click on the hyperlinked cell to view the sheet with the detailed information.

Critical: no backups exist

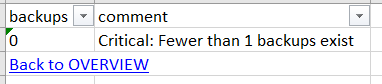
In this case, the worksheet has a single record that says that the database has never been backed-up.    This is a critical concern because if the system fails, data can be lost.  There is also a hyperlink back to the “OVERVIEW_EXPERT” worksheet.  This “Back to OVERVIEW” link appears in every detail worksheet to ease navigation.

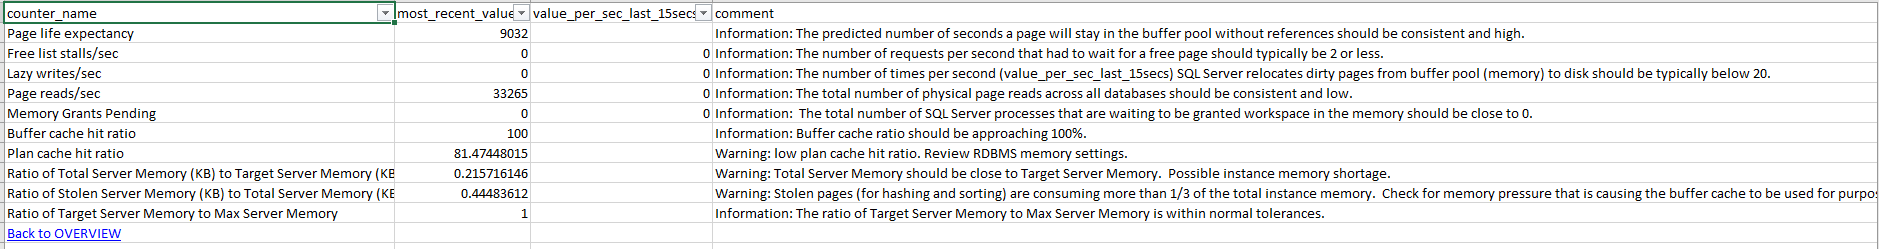
In the example below, “Memory Pressure”, the detail worksheet displays memory pressure warnings reported by SQL Server.  When the RDBMS reports that there is memory pressure, it is an indication that there is, or soon will be, performance and/or scalability problems.

The Comments column (always found on the far right) describes the issue and the recommended course of action at a high level.  Note that the amount of information reported is much greater than the “BackUp” example (more columns) and that the information is of a highly technical nature, requiring specialized knowledge to understand. 

The Comments column is egdbhealth’s best effort to make the detail digestible and actionable with incomplete knowledge of the domain.  In some cases, the Comments column will provide links to Internet resources that offer more information to support a deeper understanding.

Here is another example that identifies tables that have geometry columns that do not have spatial indices:

Critical: missing spatial indices

The absence of spatial indices on geometry columns will degrade the performance of spatial queries.  In this case, the “Comment” column recommends that spatial indices be created (or rebuilt) to heal the problem.

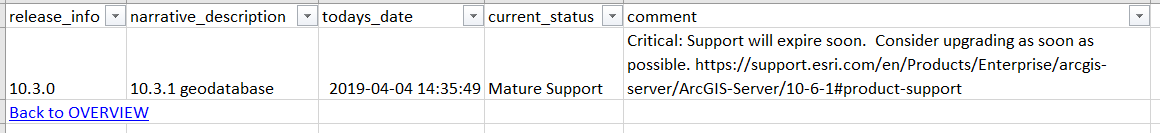
In this next example, the problem is that the release of the eGDB is quite old, indicating that it should be upgraded.  Note that the “Comments” column provides a link to more information (online):

Critical: egdb release support will expire soon

Warnings

“Warnings” follow the same pattern as “Criticals”.  However, as the name implies, they are a lower priority for review.  Note that a given evaluation may have both critical and warning findings.

In the example below, egdbhealth is reporting that there are stale or missing statistics on a variety of objects in the eGDB:

Warning: stale and missing RDBMS statistics

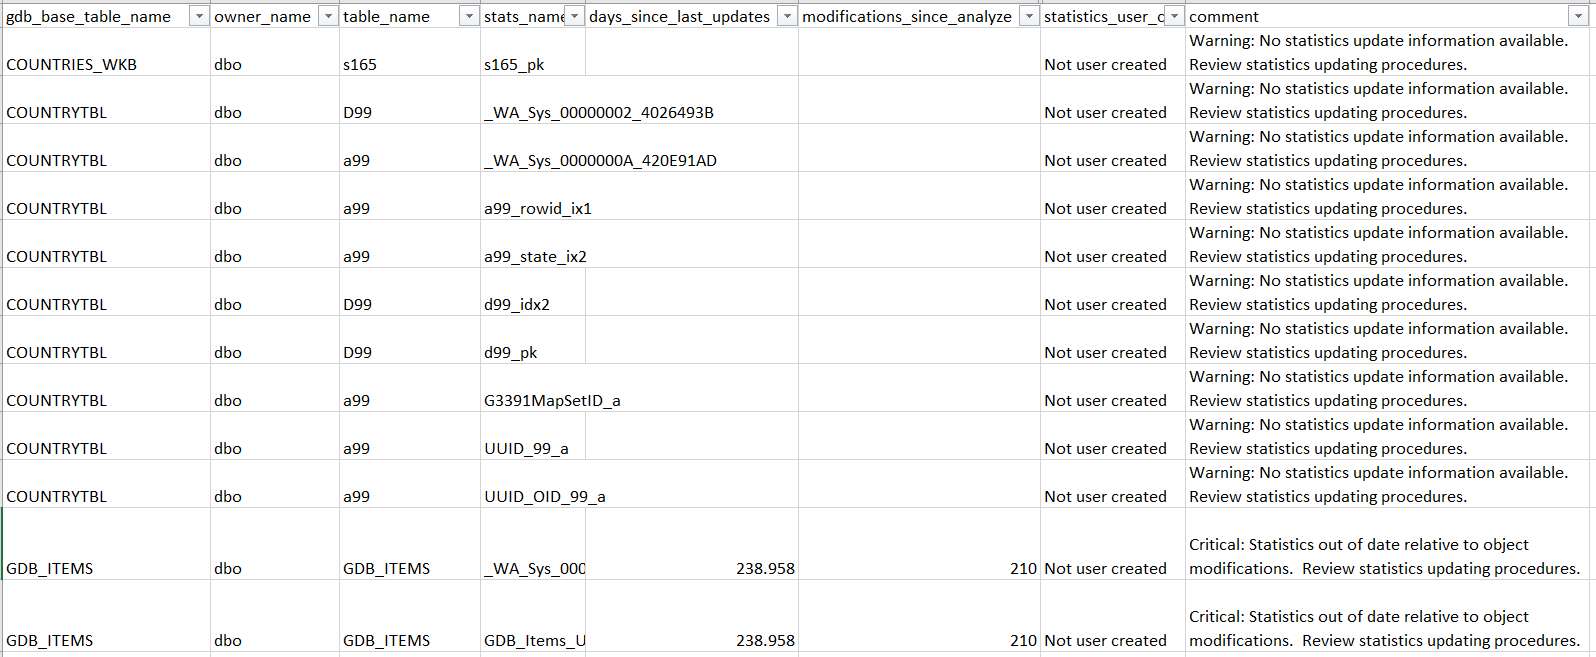
Depending on the details of the specific statistics, the finding is flagged as “Warning” or “Critical” in the Comment column (always at the far right). 

Here, in cases where no statistics information is available, the record is treated as a “Warning” because of the uncertainty.  Statistics that have information indicating that they have not been updated recently, or there have been a lot of changes since the last update, are flagged as “Critical”. 

The RDBMS’ cost-based optimizer uses these statistics to determine the best query execution plans.  Thus, if the statistics are not current with respect to the state of the data, the optimizer may not make good choices and the performance of the system will be sub-optimal.  

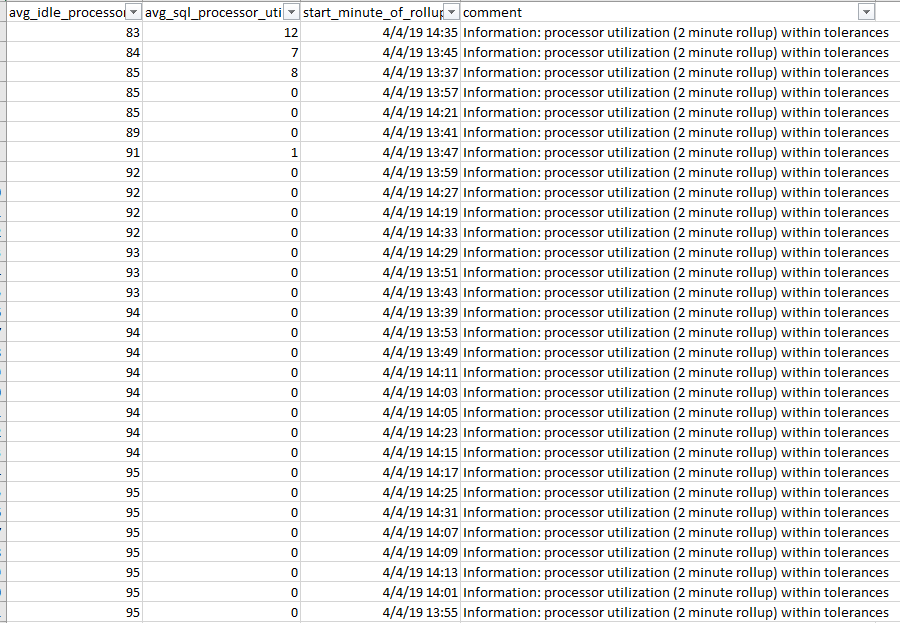
In the example below, most of the records are “Informationals”, simply reporting facts about the system.  But, there are a few rows that have “Warnings”. 

Warning: non-RDBMS processor utilization

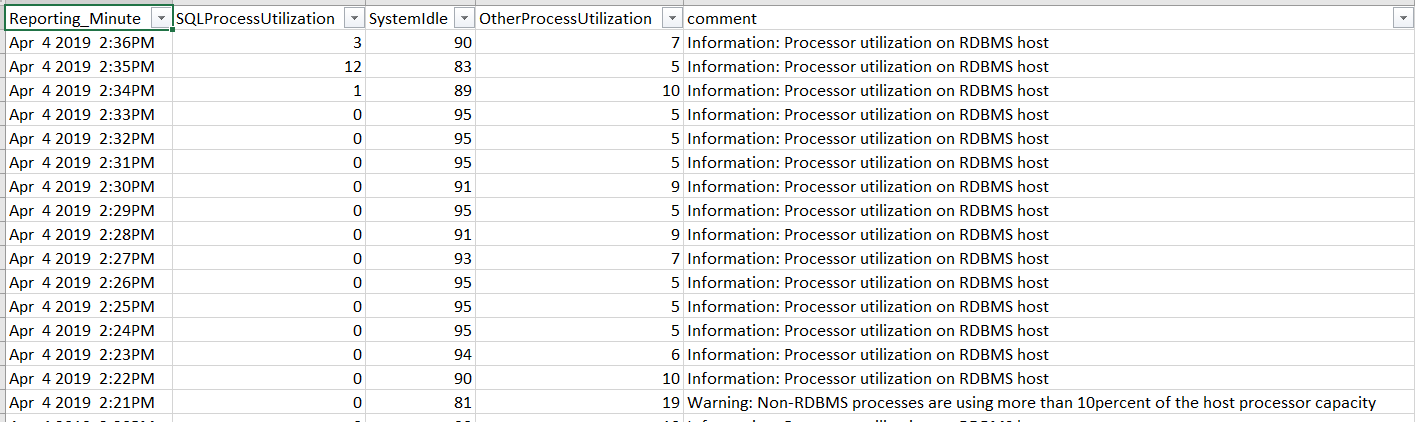
The Warnings are noting that, for a short period of time, the machine running SQL Server had more than 10% of its processor capacity used by a process other than SQL Server itself.  This is not a condition that causes a performance or scalability problem.  However, as most RDBMS systems are intended to run on dedicated machines, this may be an indication that there are other processes that do not belong or need special attention in the administration of the system. 

Informationals

“Informationals” follow the same pattern as the other types of findings.  However, the information is not evaluative in nature.  As it is essentially descriptive, it could be placed in the Context Excel file.  There are a few reasons why it is in the Expert file instead:

  1. The findings may not always be Informational … depending on the conditions encountered.
  2. The information is relatively volatile (i.e. changes over time). The Context Excel file is designed to provide information that is relatively static in nature.

The example below illustrates this first case:

Informational: egdb license expiration

The licensing of this eGDB will not be a concern for many months.  But, in about six months, if the license has not been updated, this message will no longer be informational.

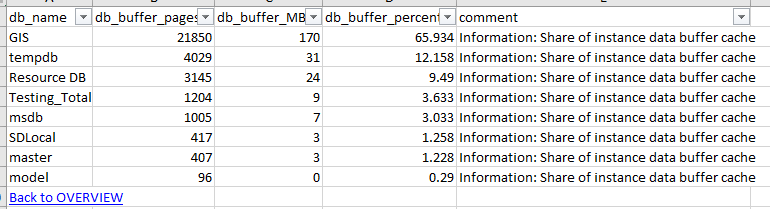
Similarly, the finding below about the underlying database file sizes could change at any time:

Informational: database file sizes

Thus, these descriptive pieces of information are reported in the Expert Excel, even though they are not currently reporting an evaluative finding that is negative.

Taking Action to Improve Health

Just as it is impractical to describe all of the individual evaluations in this document, it is impractical to provide action instructions for each one.  Instead, this article discusses the process of understanding and acting on the evaluative information, along with specific examples.

The process involves the following steps:

  1. Understand the evaluation
  2. Validate the evaluation
  3. Try to resolve the evaluation
  4. Validate the resolution

Understand the Evaluation

Some evaluations are easier to understand than others.  In those fortunate cases where the “comments” column adequately communicates the concern, this step happens automatically.  In othere cases, some research may be appropriate.

For example, the findings below report that Checkdb has never been run on the databases in this SQL Server instance (it flags the eGDB as critical, whereas the other databases are warnings):

Checkdb warnings

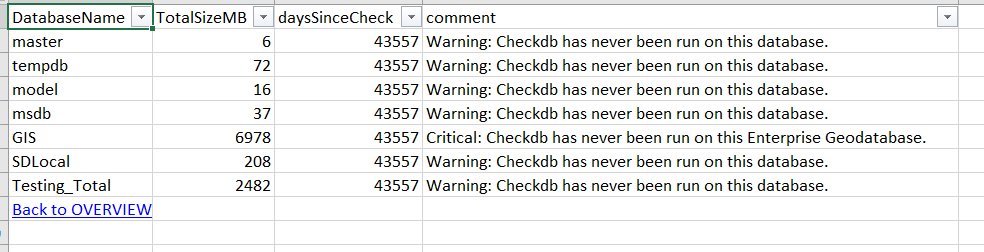
If you are not already familiar with Checkdb, an Internet search for “SQL Server Checkdb” will return results to help you understand.  In many cases, a modest research effort such as this will be all that is necessary to understand an evaluation which is in a topic that is unfamiliar to you.

In this case, an Internet search would likely surface the following links, offering more information and suggested actions: https://docs.microsoft.com/en-us/sql/t-sql/database-console-commands/dbcc-checkdb-transact-sql?view=..., https://www.mssqltips.com/sqlservertip/4381/sql-server-dbcc-checkdb-overview/, and https://www.brentozar.com/blitz/dbcc-checkdb-not-run-recently/.  In short, Checkdb runs a variety of internal checks on the database to identify possible corruption and other issues.  So, it is good to run it once in a while to avoid such problems.

Validate the Evaluations

It is useful to validate evaluations before taking action because, for a variety of reasons, the information returned may have imperfections or require some judgement. 

For example, in the “Instance” category below, there are 2 “Critical” Memory Pressure Warnings evaluations, but the Memory Pressure evaluation is only reporting “Informationals”, not “Warnings” or “Criticals”.

Various memory pressure indicators

In this case, the situation is explained by the fact that there many different indicators of memory pressure.  At any given time, and over time, they do not necessarily all point to the same conclusion.  Thus, you must weigh the related information before concluding that action is warranted (and what action is warranted).

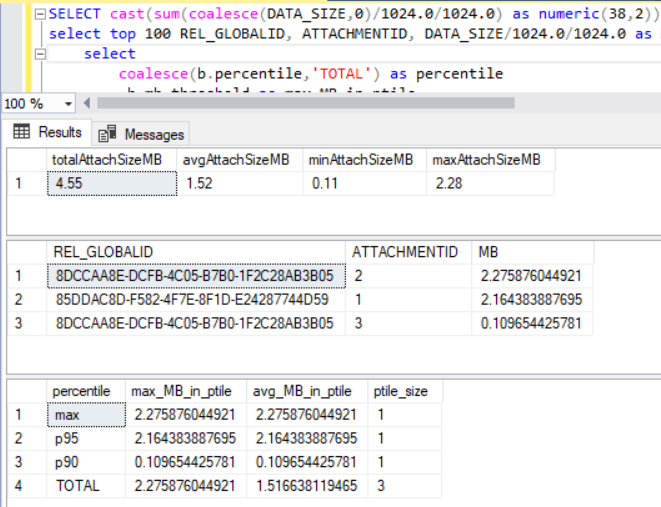
In other cases, the evaluations may benefit from your judgement about the detailed information provided in the findings sheet.  For example, this detail about “Long Elapsed Time Queries” has surfaced that there are some queries that spend very long time in SQL Server.

Queries with long elapsed times

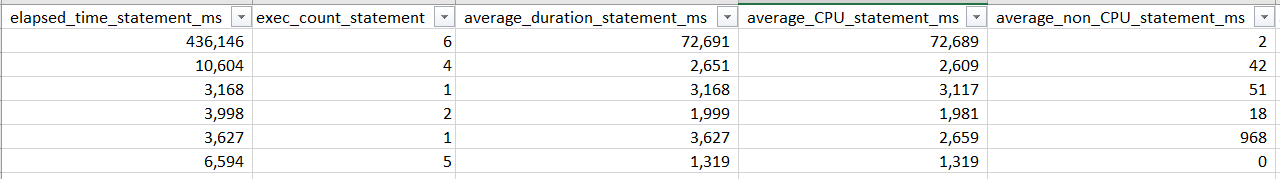
In the first row, there is a query which has an average duration of 72 seconds (third column).  However, it has only be executed 6 times in the period for which these statistics support. 

Egdbhealth does not know the period of the statistics (perhaps they were just flushed a few moments ago).  And, egdbhealth does not know if 6 executions is a lot or a little.  Here, it is more than other queries, but it is not many in absolute terms.  Finally, egdbhealth does not really know what “slow” is for this particular query.  Perhaps this supports a “batch” process that is expected to take a long time.  To make this determination, you would scroll over to the right (not in this screen capture) to view the SQL statement to see what the query is doing.  Then, you can make an informed judgement, based on how your system is used, and the reasonable expectations that users have for its performance, about whether or not these queries with “long elapsed times” are ones that should be actionable for you.

Try to Resolve the Evaluation

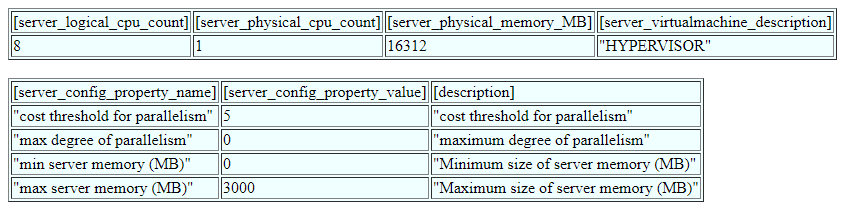
Your understanding of the evaluation will guide your efforts to address the problem.  In some cases, such as the one below, egdbhealth will point to Internet-based resources that will help you plan and carry-out the actions.

Some comments provide hyperlinks to additional information

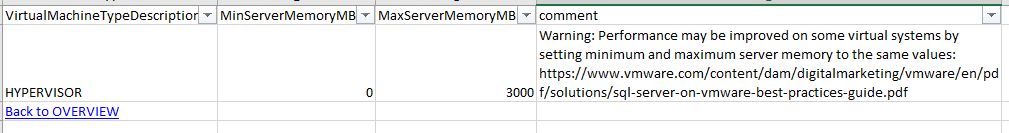
In this case, egdbhealth recognized that the SQL Server instance is running on virtual hardware.  In the case of VMWare (and perhaps other platforms), best practice advice suggests that the minimum server memory and maximum should be set to the same value.  Once you understand it, this change is relatively straight-forward to make and may require only a brief consultation with the virtual machine platform team to confirm that it corresponds with best practices in their minds also.

In other cases, egdbhealth’s guidance will be more oblique and you will need to rely upon specialists within your organization, Esri Technical Support, or your own Internet research to come up with an action plan.  

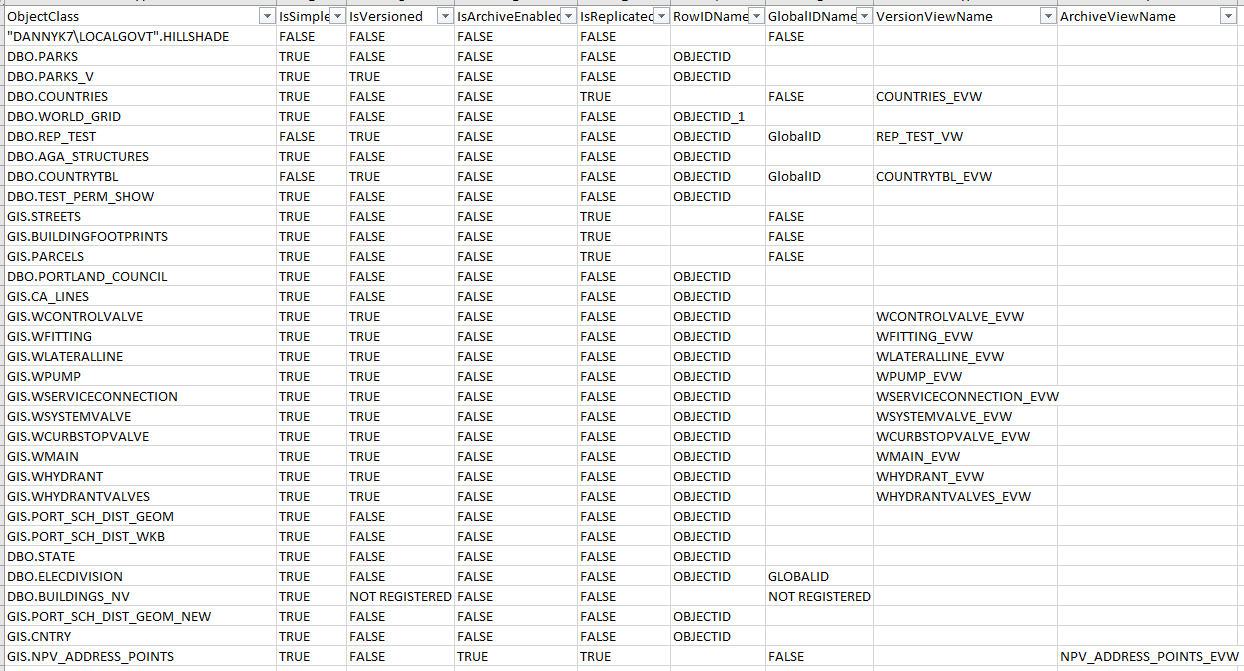
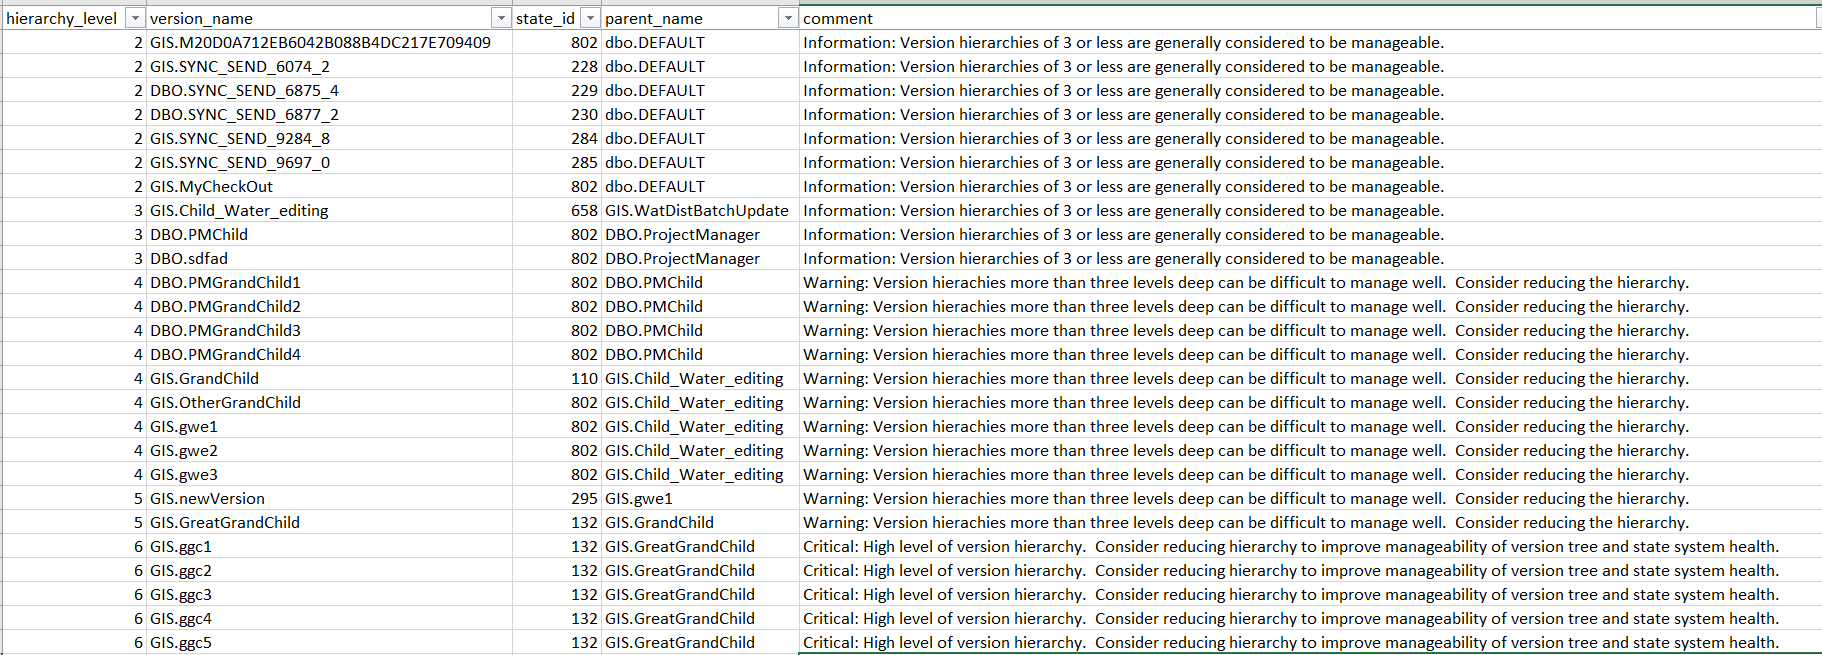
Sometimes actions will involve changes that will take a considerable amount of organizational and/or system change.  In the example below, egdbhealth is suggesting that the performance of the versioning system could be improved by having less hierarchy in the version tree.  Changing the way versioning is used by an organization is a major undertaking that requires planning and time.  In this case, you can expect to spend time planning changes, socializing them within your organization, and then carrying it out.

Version tree hierarchy refactoring advice

Validate the Resolution

Running egdbhealth again, after your initial efforts to resolve the evaluation(s) will effectively validate whether or not your efforts succeeded.  Note that, when you run egdbhealth again on the same eGDB, the prior Expert Excel file is placed in the “archive” subdirectory for your reference.  (The Content Excel file is not re-created, because its information is less volatile.)

Naturally, you hope to find all of the “Criticals” or “Warnings” that you addressed have disappeared in the new Expert Excel output.  And, this can be expected where you have correctly understood the problem and taken effective action.

For example, a finding such as the one below (that the most recent compress failed) will be resolved in the “OVERVIEW_EXPERT” sheet as soon as you address the problem.  In this case, as soon as you successfully compress and re-run egdbhealth, this evaluation will be resolved.

Failure of recent compress

In a few cases, however, the “Critical” or “Warning” classifications will not fully resolve themselves even though the current condition is no longer the same.   For example, the “Compress During Business Hours” evaluation reports on the recent history of compresses, not just the most recent compress.  You can expect the evaluations to remain unchanged in the “OVERVIEW_EXPERT” sheet for some time. 

History of compresses during business hours

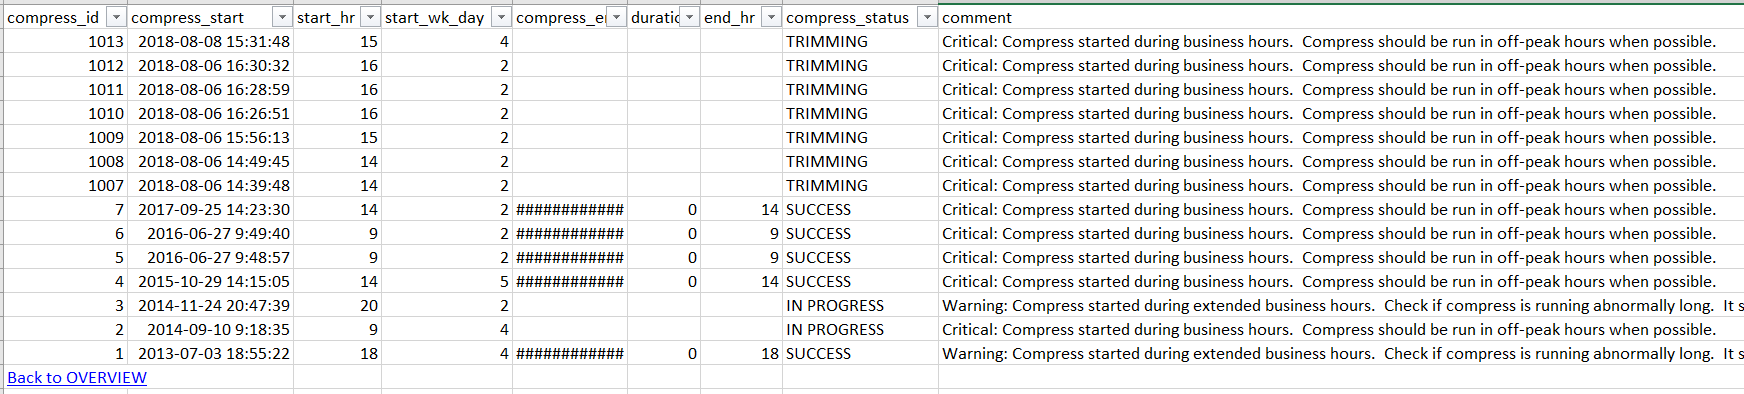
The detail sheet and other sheets in the Versioning category will illustrate that your recent compress did not occur during business hours (if that is the case).  Thus, you have resolved the evaluation.  And, over time, egdbhealth will allow itself to agree.

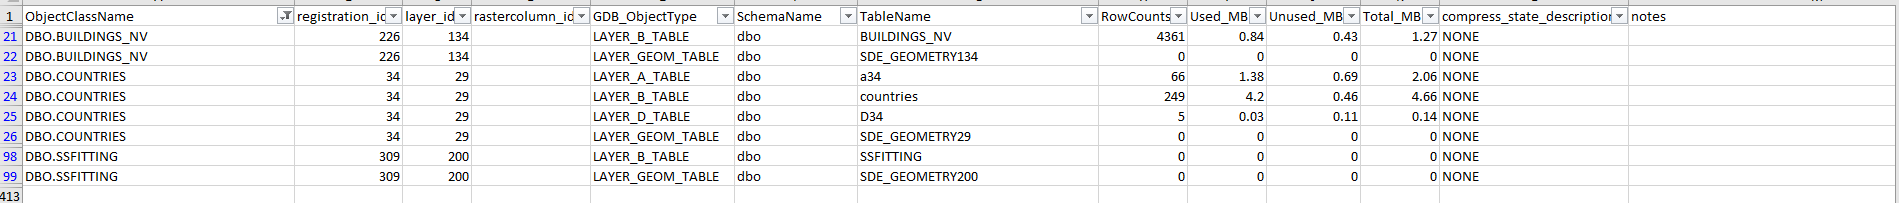
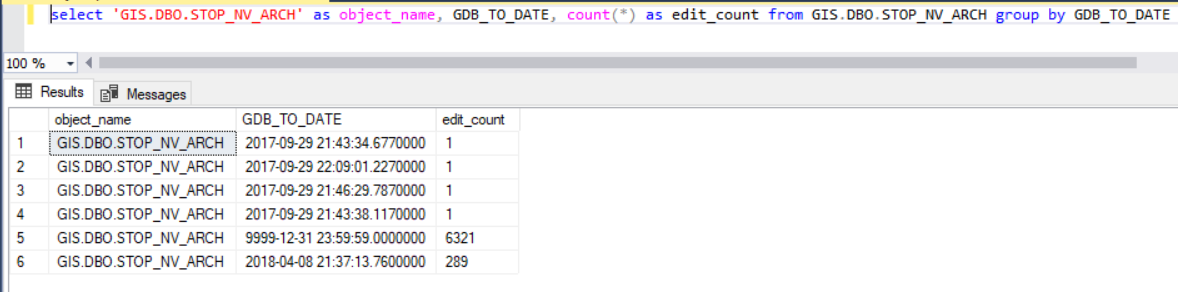
Finally, you will find that some evaluations are volatile.  In repeated runs of egdbhealth, they will seem to be present or absent without relationship to your specific actions.  For example, the evaluation below reports on the percentage of base table records that are in the delta tables (“A” and “D” tables).  Where those percentages are high, it offers a negative evaluation.

Base and delta table record counts

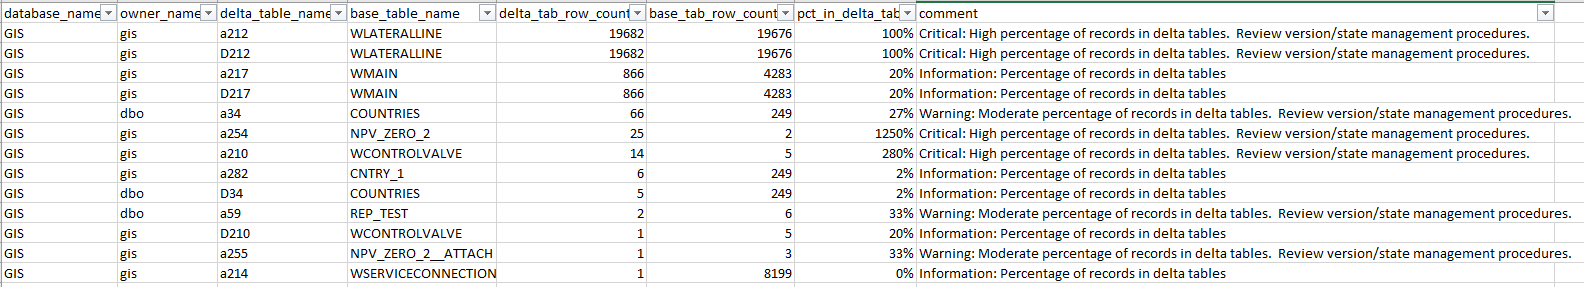
The action you may have taken in response is to compress the eGDB.  The effectiveness of that action, however, would depend upon the reconciling and posting that is occurring on the system.  So, if there had been no new reconcile and post activity, the compress would not have changed the evaluation.  On the other hand, if there had been reconcile and post activity, or if a very stale version had been deleted, the compress may have resolved many of the findings.  It is also true, however, that even with the ideal reconciles, posts, and compresses, editors might be generating more updates which are populating the delta tables at the same time as you are de-populating them.

The “Memory Metrics” example discussed earlier in this article are another case where you can expect volatility in evaluations.  This is because memory pressure indicators will be triggered by different conditions in the database.  Your informed judgment will be required to determine whether the recurring evaluations indicate a problem that needs further action.

The point is that the goal of taking action is not necessarily to achieve a “clean report card” with no negative evaluations.  The goal should be to have only the evaluations that are appropriate to your system.  In the process, you will have deepened your understanding of your eGDB system and offered many tangible improvements to the users of that eGDB.

Summary

The primary purpose of egdbhealth is to help administrators understand and improve the health characteristics of eGDBes.  Focusing on the Expert Excel file output, and prioritizing your analysis based on the Critical/Warning/Informational classification scheme, you can address the aspects of an eGDB which are most in need of investigation.  Some of the evaluations offered by egdbhealth may require various kinds of research to understand and determine a course of action.  Colleagues, Esri Technical Support, and Internet resources can be used to build your knowledge.  When you do take action to improve the health of your eGDB, be sure to run egdbhealth again to validate and document your progress.

I hope you find this helpful, do not hesitate to post your questions here: https://community.esri.com/thread/231451-arcgis-architecture-series-tools-of-an-architect


Note: The contents presented above are recommendations that will typically improve performance for many scenarios. However, in some cases, these recommendations may not produce better performance results, in which case, additional performance testing and system configuration modifications may be needed.

more
5 2 5,393
AdamCarnow
Esri Regular Contributor

These eight videos cover the GIS Manager Track sessions from the 2018 Esri International User Conference presented July 11-12, 2018 in San Diego, CA.  They are:

  • Enterprise GIS: Strategic Planning for Success
  • Communicating the Value of GIS
  • Architecting the ArcGIS Platform: Best Practices
  • Increase GIS Adoption by Integrating Change Management
  • Governance for GIS
  • Moving Beyond Anecdotal GIS Success: An ROI Conversation
  • Workforce Development Planning: A People Strategy for Organizations
  • Supporting Government Transformation & Innovation

A special thanks to those that helped present these sessions: Clinton JohnsonMichael GreenMatthew LewinWade KloosJustin KruizengaAndrew Sharer‌ Eric_Apple

https://www.youtube.com/playlist?list=PLaPDDLTCmy4auFPPuXEzGYkQUQi8AG_uh

more
1 0 696
125 Subscribers