What is Infrastructure as Code?
Taken directly from Microsoft,
"Infrastructure as Code (IaC) is the management of infrastructure (networks, virtual machines, load balancers, and connection topology) in a descriptive model".
In the simplest terms, Infrastructure as Code (IaC) is a methodology to begin treating cloud infrastructure the same as application source code. No longer are changes made directly to the infrastructure, but to the source code for a given environment or deployment. This change in behavior will lead to environments that are easily reproducible, quickly deployable and accurate.
Note: This post is one (1) in a series on engineering with ArcGIS.
What is Terraform?
Terraform is a tool for building, changing, and versioning infrastructure safely and efficiently. Terraform can manage components such as virtual machines, networking, storage, firewall rules and many others. To define what needs to be deployed or changed, terraform uses what is called a terraform configuration which can be made up of one or more individual files within the same folder. Terraform files utilize the file extension
.tf
as well as HCL (HashiCorp Configuration Language) as the configuration language. HCL is a structured configuration language that is both human and machine friendly for use with command-line tools, but specifically targeted towards devops tools, servers, etc.
In complex deployments, administrators may find they can utilize a different configuration file for each aspect of their environment as such,
/environment_a
/production
network.tf
machines.tf
storage.tf
security.tf
/staging
network.tf
machines.tf
storage.tf
security.tf
whereas with simple deployments, a single file may be sufficient, such as
/environment_a
main.tf
To actually create and manage infrastructure, terraform has a number of constructs to allow users to define Infrastructure as Code but the most important two are Providers and Resources.
Resources
Resources are the mechanism that tell terraform how the infrastructure should be deployed and configured. Each cloud provider will have its own list of Resources that users will have access to. An example would look something like this which creates an azure resource group and a virtual network within.
resource "azurerm_resource_group" "rg" {
name = "prd"
location = "westus2"
}
resource "azurerm_virtual_network" "vnet" {
name = "prd-vnet"
location = "westus2"
address_space = ["10.0.0.0/16"]
resource_group_name = "prd"
}
Providers
Providers are the mechanism for defining what cloud provider or on-premise Resources are available for use. Each provider offers a set resources, and defines for each resource which arguments it accepts, which attributes it exports, and how changes to resources of that type are actually applied to remote APIs. Most of the available providers correspond to one cloud or on-premises infrastructure platform, and offer resource types that correspond to each of the features of that platform. In simpler terms, if the goal is to define infrastructure on Azure, an Azure based provider must be used before Resources can be defined.
A provider example for Azure would look something like this,
provider "azurerm" {
subscription_id = "this-is-not-a-real-subscription-id"
client_id = "this-is-not-a-real-client-id"
client_secret = "this-is-not-a-real-client-secret"
tenant_id = "this-is-not-a-real-tenant-id"
}
Terraform has multiple methods for authenticating to a given cloud provider and in this example, a Service Principal is being utilized.
State
Lastly, terraform makes use of a State File that keeps track of the infrastructure that has been deployed and configured. This state file is what allows terraform to run checks against the last recorded state of an environment compared to the current run and provide users the delta so validation can be done before making changes. This aspect is very important in that it allows terraform to be idempotent, which is a key aspect of IaC.
Infrastructure Life-cycle
For the purposes of this introduction, we will be using the attached terraform template as the basis for the following examples. This template will be posted to GitHub in the near future for future articles to utilize and build off. It is designed to deploy the following within an Azure subscription.
Before it can be deployed, the deployInfo variable group (Map) will need to be populated. When creating the Service Principal, the following documentation (Service Principal creation) can be reference for assistance. Terraform will also need to be available locally. The steps to ensure it is can be found here.
- Resource Group
- Virtual Network
- Subnet
- Network Security Group
- Rule to allow 80 and 443 traffic from the internet into the virtual network
- Rule to allow RDP access (3389) into the virtual network from the public IP of the person who deploys the template. This is accomplished by querying the web during deployment and retrieving your public IP. This workflow is not recommended in production environments and is only being used for example purposes.
- Rule to block all other internet traffic into the virtual network.
- Storage account
- Availability Set
- Public IP
- Network Interface
- Virtual Machine
- Windows Defender Extension
- Recovery Services Vault Extension
- Key Vault
- Recovery Services Vault
Creation
Once terraform is available locally and the deployInfo variable map has been completed, the first step in deploying infrastructure is to initialize terraform. This can be accomplished by navigating to the directory in which you have saved the above template with the .tf file extension and running the following command, which will prepare various local settings and data that will be used by subsequent commands.
terraform init
The output from initializing terraform will resemble the following.
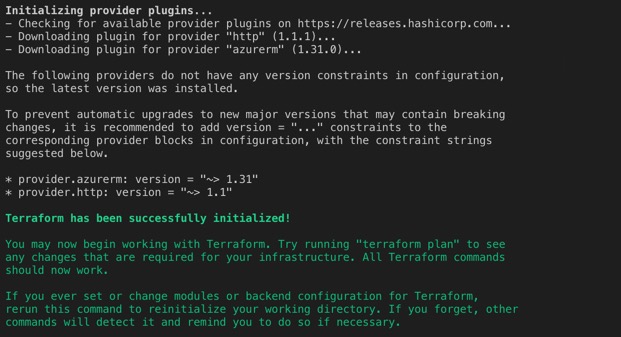
With terraform successfully initialized, the next step in the process is to have terraform review the template and determine what changes need to take place. This step will have terraform compare the template with the current state file and produce an output showing the deltas as follows. To do so, use the following command.
terraform plan
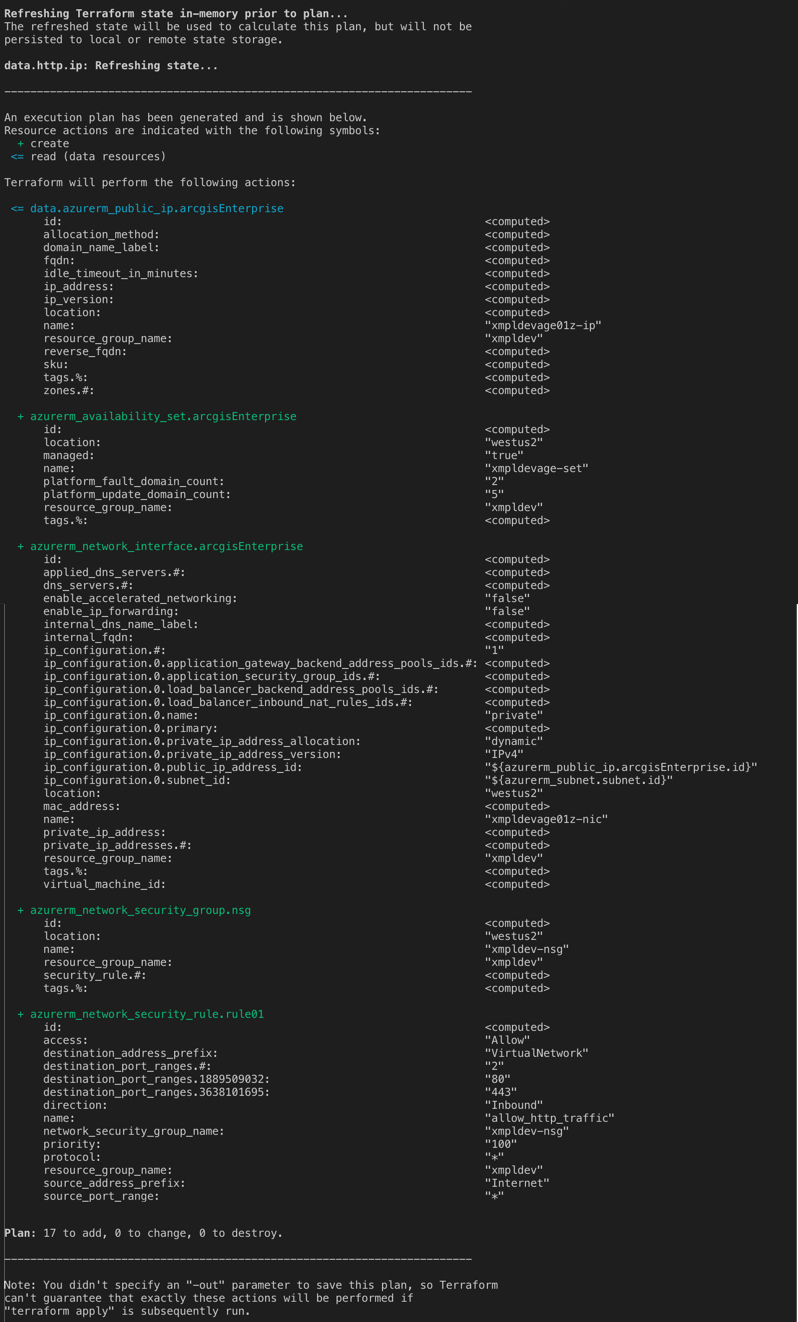
Output has been truncated.
As this is the first run of terraform, terraform is only able to see resources it needs to add (create). Later in this post, we will walk through updating existing resources.
With terraform successfully prepared to deploy our infrastructure, we can being the deployment by using the following command which will start the process of creating the resources within Azure and provide the following output when complete.
terraform apply

Updates
As the deployment is utilized, it may be determined that the current infrastructure is not adequately sized and resources need to be increased. As our resources are defined as code, so is the virtual machine sizing. Within the "arcgisEnterpriseSpecs" variable map, a variable is defined with the name "size" which is the Azure machine sizing that is used by terraform when deploying resources.
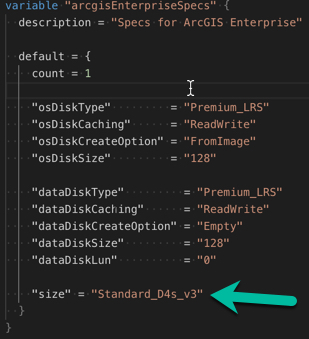
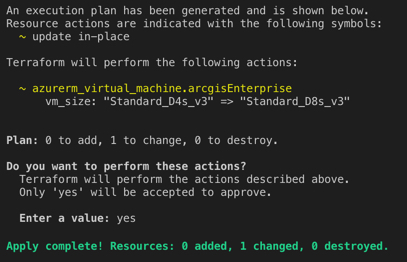
If this variable is changed to "Standard_D8s_v3" and terraform plan is ran again, it will detect a delta between what is defined in code and what is actually deployed within Azure and present this in the output as such.

Once this delta is planned and the changes are ready to be pushed to the actual infrastructure within Azure, simply running terraform apply again will begin the process.
Decommission
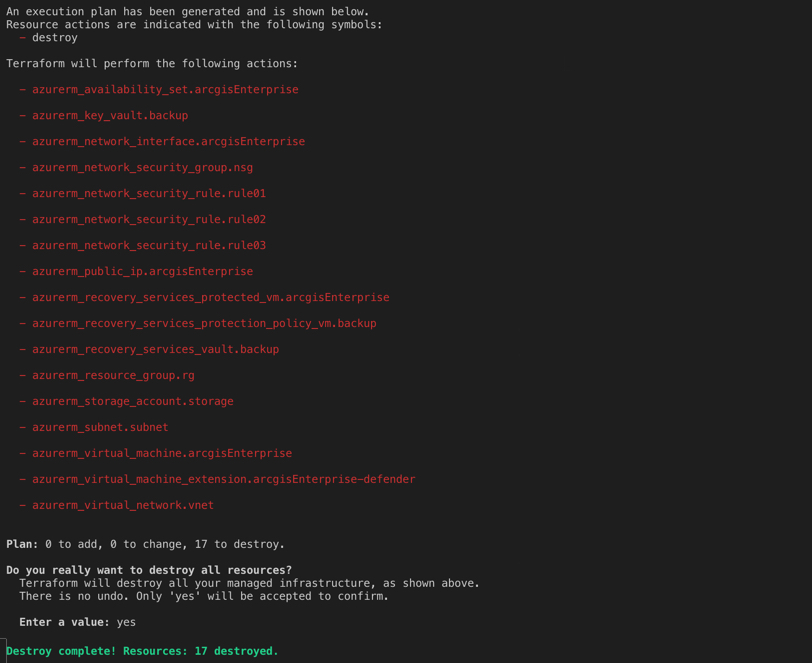
The last phase of a given deployments life-cycle is decommissioning. Once infrastructure has reached the end of it life, it must be terminated and removed and thankfully, terraform provides an easy method to do so with the following command.
terraform destroy
The output of destroying the infrastructure will resemble the following.
In conclusion, as teams aim to become more agile and move at a much faster pace, moving to modern methodologies such as infrastructure as code (IaC) is a great first step and should not be viewed as unnecessary but a crucial step in the right direction.
I hope you find this helpful, do not hesitate to post your questions here: https://community.esri.com/community/implementing-arcgis/blog/2019/07/03/engineering-arcgis-series-t...
Note: The contents presented above are examples and should be reviewed and modified as needed for each specific environment.
