- Home
- :
- All Communities
- :
- Services
- :
- Implementing ArcGIS
- :
- Implementing ArcGIS Blog
- :
- ArcGIS Server Tuning and Optimization with System ...
ArcGIS Server Tuning and Optimization with System Log Parser
- Subscribe to RSS Feed
- Mark as New
- Mark as Read
- Bookmark
- Subscribe
- Printer Friendly Page
- What is System Log Parser?
- Getting Started
- Configuring System Log Parser
- Review the System Log Parser report
- Summary
- Statistics
- Resources
- Methods
- Queue Time
- Users
- Time
- Throughput per Minute
- Elapsed Time of All Resources
What is System Log Parser?
System Log Parser is an ArcGIS for Server (10.1+) log query and analyzer tool to help you quickly quantify the "GIS" in your deployment. When run, it connects to an ArcGIS for Server instance on port 6080/6443/443 as a publisher (or an administrator), retrieves the logs from a time duration (specified as an input), analyzes the information then produces a spreadsheet version of the data that summarizes the service statistics. ArcGIS Monitor uses the command-line version of System Log Parser (slp.exe) for data capture.
System Log Parser supports the following service types:
|
|
|
|
|
|
|
|
|
|
|
|
|
|
|
System Log Parser (github.com), a free-standing application or Add-on for ArcGIS Monitor, is an effective tool for diagnosing and reviewing infrastructure functionality.
Getting Started
This section will configure ArcGIS Server to collect logs at the level needed for the tool and set up System Log Parser to generate a report (MS Excel).
1. Ensure the following conditions are met on the machine you’ll be running System Log Parser from:
- 64-bit Operating System:
- Windows 7 (64 bit), Windows 8.x, Windows 10
- Windows Server 2008 64 bit, Windows Server 2012, Windows Server 2016
- RAM: 4 GB
- Microsoft .NET Framework 4.5 or 4.6
- Microsoft Excel 2010 or newer (or appropriate .xlsx viewer).
2. Set your ArcGIS Server logs to Fine on EACH server you’d like to get metrics on. Complete instructions on how to change ArcGIS Server log levels can be found here: Specify Server Log Settings
Note: I recommend running the logging at FINE for AT LEAST one week prior to running System Log Parser. This should give you a fairly clear picture of a typical weeks load.
3. Download and extract System Log Parser here: github.com
4. Extract the .zip file.
Note: This is BOTH the user interface and the Add-on for ArcGIS Monitor. We will be focused on the user interface version for this exercise.
5. Launch System Log Parser
6. Browse to the location you extracted System Log Parser
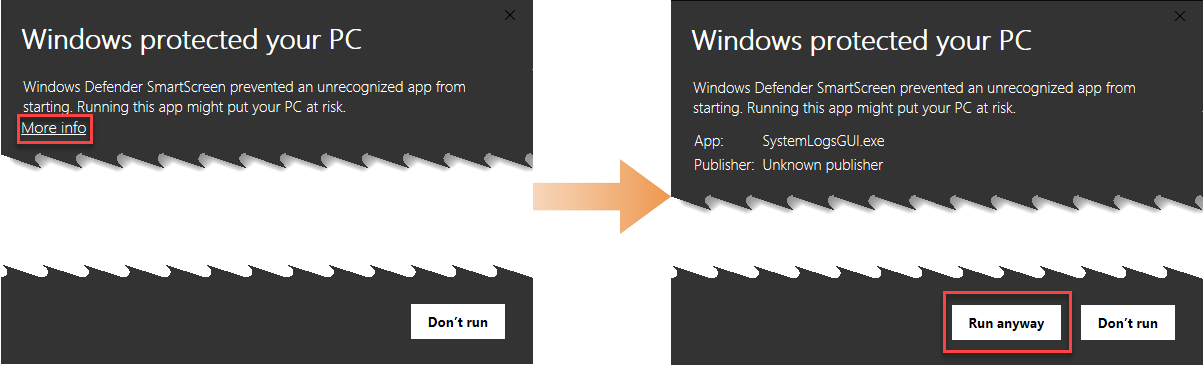
7. In the System Log Parser for ArcGIS folder, locate and launch SystemLogsGUI.exe

Note: You may be prompted that Windows has protected your PC. If you do get this prompt, please click More info and then click Run Anyway.
Configuring System Log Parser
The following outlines the configuration required to set up System Log Parser to analyze a week's worth of logs.
Note: The System Log Parser will automatically access logging for all clusters that are part of an ArcGIS Server Site. If you have multiple ArcGIS Server Sites configured
Click the ArcGIS Server (Web) button to display the following:

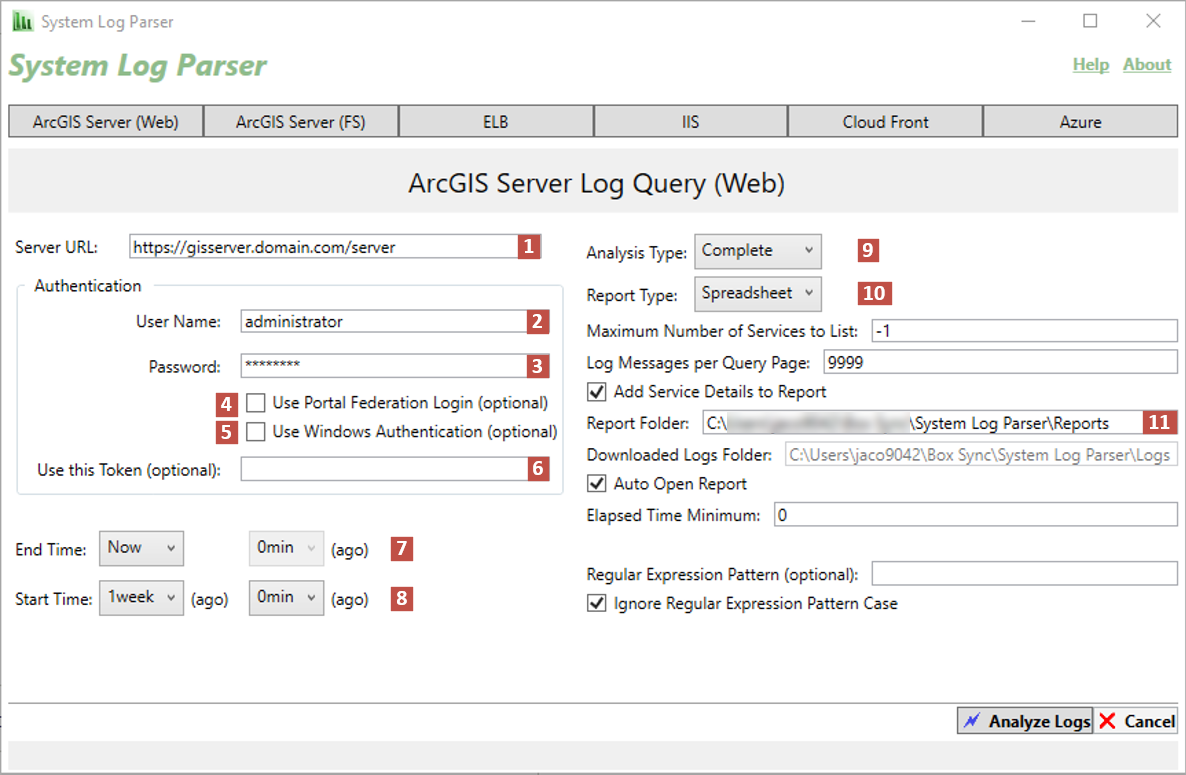
Fill out the above form as indicated below:
1. Enter the Server URL.
- The typical syntax with ArcGIS Server 10.2 or higher is: https://<host_name>:<port_number>/arcgis
- The typical syntax with ArcGIS Server 10.1 is: https://<host_name>:<port_number>/ArcGIS
Note: If your URL structure is different, enter it.
2. Enter the ArcGIS Server Manager user name with a publisher or better permissions.
3. Enter the user's password
4. Check this box if you are accessing a Site federated to Portal for ArcGIS
Note: Consider using a web adapter address for the Server URL: https://<webadaptor_name>/server
Note: If accessing over the internet, this assumes that the web adapter was registered with administrative access to ArcGIS Server
5. Check this box if you use IWA(Integrated Windows Authentication)
6. If needed, specify a token(advanced option)
7. Select an End Time (Now)
8. Select Start Time (1 week)
9. Select Analysis Type (Complete)
Simple: Provides only the Service Summary page data.
Note: This mode will also generate a list of the underlying data source by service and layer in the service.
WithOverviewCharts: Provides the Service Summary page plus charts of Request Count, Average Request Response Time, Instance Creation Time, Wait Time (Queue Time), and Max Request Response Time.
Complete: Provides a Service Summary page plus all data and charts in separate tabs for all services.
- ErrorsOnly: Provides a report of just the errors.
- VerboseMode: Provides full verbose log analysis (Limited to 12 hours).
10. Select Report Type (Spreadsheet)
11. Specify where to output the report (Default is your My Documents location)
Click Analyze Logs. 
This process can take a few minutes or longer; this all depends on the number of transactions logged.
Review the System Log Parser report
When System Log Parser finishes running, it will open the report in Excel if present. If you run this from a machine without Microsoft Excel, move it to a computer with Excel and open it.
You will note a summary tab and several tabs listed across the bottom of the spreadsheet. We'll cover each in further detail below, by tab.
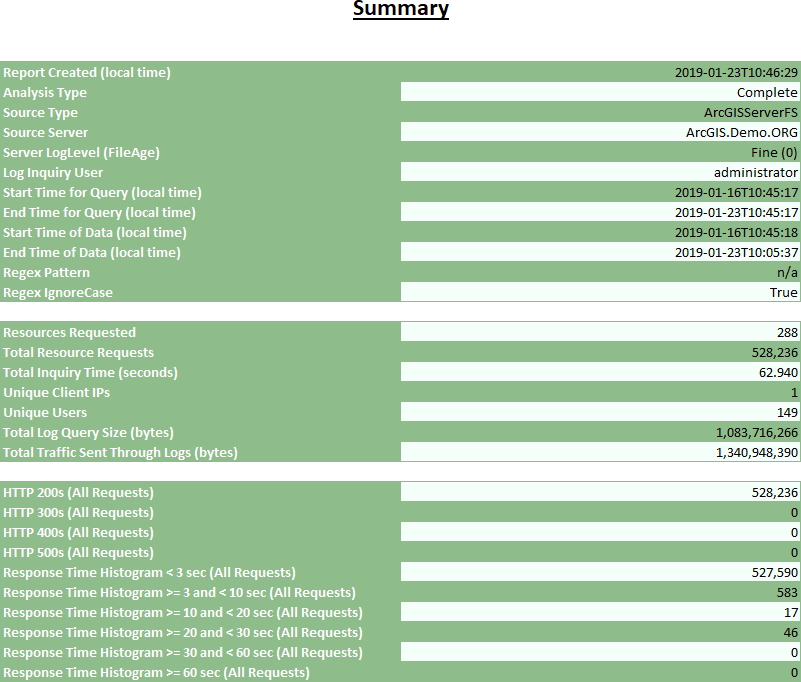
Summary
When the Excel report opens, you will see the Summary tab. The below screen grab shows what server this was run against and some summary statistics.
Statistics
On the bottom of the Excel report, select the Statistics tab to view a table of all services by layer and service types. This is where we'll spend most of our time. Please read the rest of this post, then click here.
Resources
On the bottom of the Excel report, select the Resources tab to view several charts:
- Top 20 Resources by Count
- Top 20 Resources by Average Response Time
- Top 20 Resources by Maximum Response Time
Methods
On the bottom of the Excel report, select the Methods tab to view several charts:
- Top 20 Methods by Count
- Top 20 Methods by Average Response Time
- Top 20 Methods by Maximum Response Time
Queue Time
At the bottom of the Excel report, select the Queue Time tab to view any services that had to wait for an ArcSOC to return a result. In an ideal setting the below is the desired value:

Users
At the bottom of the Excel report, select the Users tab to view a chart of the top 20 users by request count.
Time
At the bottom of the Excel report, selects the Time tab to view a chart of requests by day.
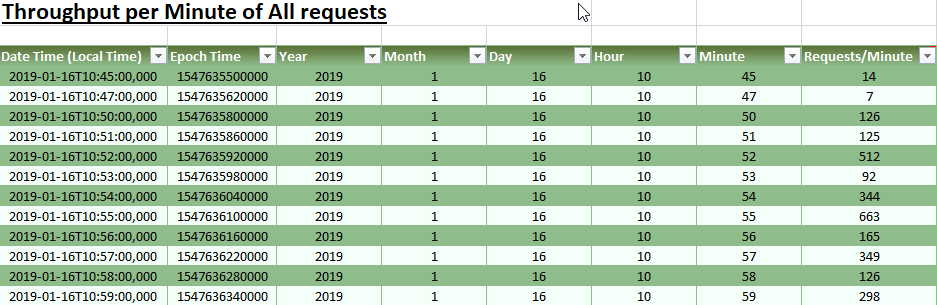
Throughput per Minute
At the bottom of the Excel report, select the Throughput per Minute tab to few a minute-by-minute breakdown of requests.
Below is a sample of what information can be found on the tab:
Elapsed Time of All Resources
At the bottom of the Excel report, select the Elapsed Time of All Resources tab to view a chronological listing of all requests from the time period the System Log Parser report was generated.
I'd also like to thank Aaron Lopez for his help and continued development of this invaluable tool.
Note: The contents presented above are recommendations that will typically improve performance for many scenarios. However, in some cases, these recommendations may not produce better performance results, in which case, additional performance testing and system configuration modifications may be needed.
I hope you find this helpful, do not hesitate to post your questions here: ArcGIS Architecture Series: Tools of an Architect.
You must be a registered user to add a comment. If you've already registered, sign in. Otherwise, register and sign in.