Support for CORS will be enhanced in 4.9 and will potentially require changes to your code. Read further for the full scoop on this.
The ArcGIS API for JavaScript has long supported CORS. CORS allows web applications to bypass a browser's same origin policy and access resources or services on other servers/domains.
When the web server supports CORS, a proxy is not required to do cross-domain requests. Supporting CORS as opposed to using a proxy is helpful as it can:
- Provide a performance boost since the web application no longer has to send a CORS detection request back to its server, wait for the server to access the desired resource, and interpret the result before sending it back to the client.
- Simplify development as it is no longer necessary to maintain a proxy on your server. Avoiding the use of a proxy also ensures that web tier authentication (i.e. Active Directory) can be used when accessing secured resources.
CORS and WebGL
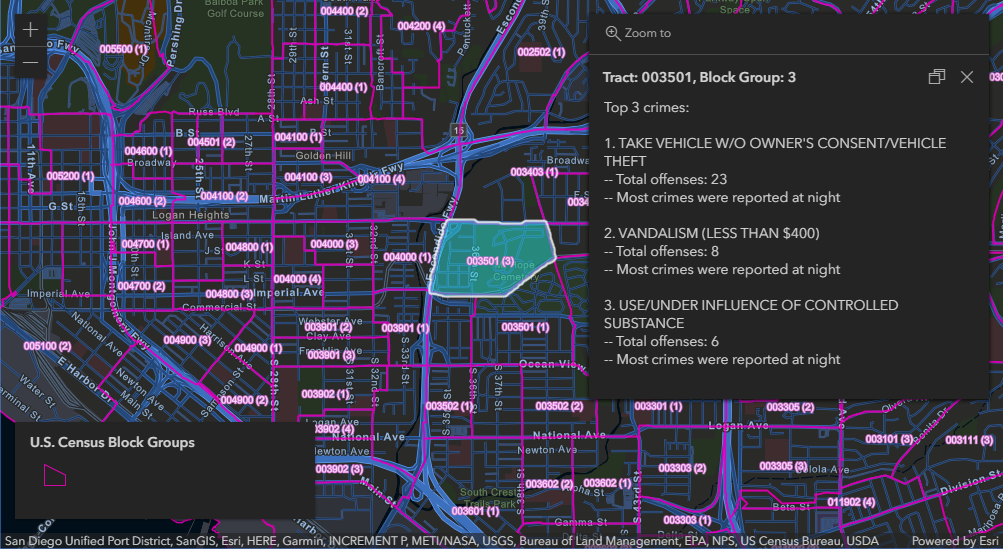
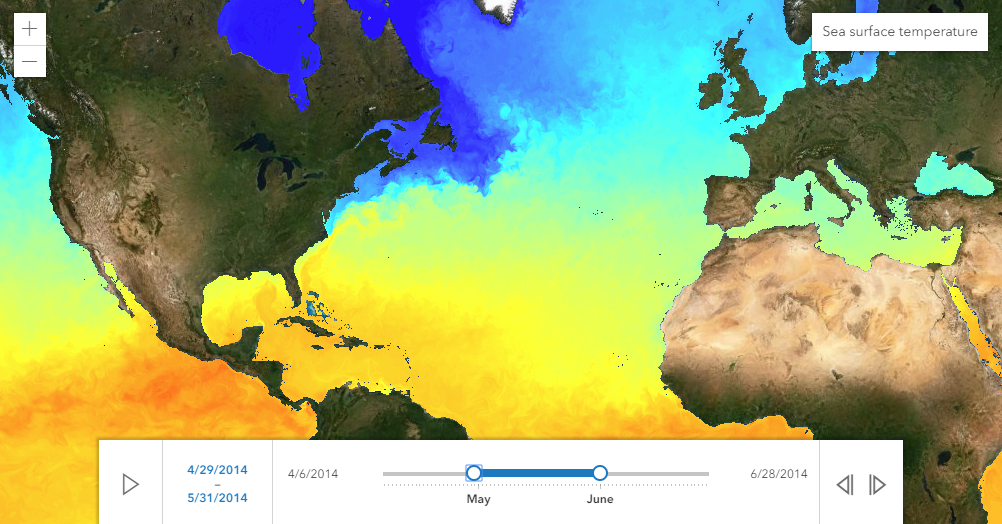
There are multiple scenarios when either CORS or a proxy is needed due to cross-domain requests for a resource. CORS is more important now than ever before when using the ArcGIS API for JavaScript due to the API’s use of WebGL. Thanks to WebGL, the API can render hundreds of thousands of features with fast performance using the GPU. However, WebGL has different requirements than the traditional method of rendering using SVG. When loading images (such as an image used by PictureMarkerSymbol), SVG simply adds an image in the DOM, while drawing on the WebGL canvas requires access to the raw image data. Since the raw image data is required for rendering, the image must meet one of the following requirements: (1) be on the same domain as the app, (2) be hosted on a server that supports CORS, or (3) a proxy must be used.
With WebGL becoming the primary way in which the API renders graphics and its requirement to access raw image data, we’ve optimized the way in which we approach CORS.
Changes to how the API will handle CORS, starting at 4.9
The API will assume web servers support CORS. Here are the details behind how the API handled CORS until 4.8, and how it will change starting at 4.9.
Previously, the API would handle CORS in the following way:
- Developers could predefine a list of corsEnabledServers to explicitly indicate whether CORS was setup for a given server.
- If the service was published with ArcGIS Server, the API would automatically send a request to see if CORS was supported (note: this resulted in an extra request to the server before a resource could be requested).
- If the server didn’t support CORS, a proxy rule could be configured (note: this resulted in the extra hop and performance hit described above).
- JSONP was used as a workaround when the server wasn't known to support CORS and the request was a GET request for JSON. An example would be using a FeatureLayer from an ArcGIS Server version 10.0 or earlier.
If none of the above criteria could be met (not listed in corsEnabledServers, not an ArcGIS Server service, and no proxy setup), the API didn’t make the request to the resource and generated a console error.
Starting at 4.9, the API will handle CORS in the following way:
If you have configured a proxy rule in your code, the API will continue to use your proxy. Otherwise, requests will always be made with the assumption that CORS is supported.
Assuming CORS support is particularly useful when you don’t know what web servers you might be accessing in advance, for example in some scenarios when loading a web map with a mash-up of services. The first request will be sent assuming CORS is supported, and if the request fails due to the lack of support the API will automatically fallback to the configured proxy (via the proxyUrl property in esri/config.request).
This change also results in a performance gain when working with ArcGIS Server because it is no longer necessary to send a CORS detection request before accessing a resource (in the case when the server isn’t listed in corsEnabledServers).
What do you need to do?
- If it doesn’t already, configure your web server to support CORS (if possible).
- Another change at 4.9 is support for JSONP is being removed, which will simplify webpack builds. If your server doesn’t support CORS, setup your proxy so that the app would fallback to using the proxy when the CORS request failed. If you have a specific requirement for using JSONP, you can use the dojo request script module as a workaround.
- If you previously used any of these APIs, they should be removed as they are no longer needed. Your CORS enabled server should “just work” since the API will make the request assuming CORS support.
esri/config.request
corsDetection
corsDetectionTimeout
corsEnabledServers*
forceProxy
useCors
esri/request
allowImageDataAccess option
* If your app is using corsEnabledServers with objects that have withCredentials: true, you should push the domain to esri/config.request.trustedServers instead.
This guide topic will be updated with the latest information about working with CORS after the 4.9 release.