Today, we are pleased to release versions 4.16 and 3.33 of the ArcGIS API for JavaScript. Here are some of the 4.16 highlights (please refer to the 3.33 link at the end for 3.x updates).
The stats
We fixed 20 bugs, added 65 new classes, created 24 new samples, and over 99% of the codebase is now written in TypeScript.
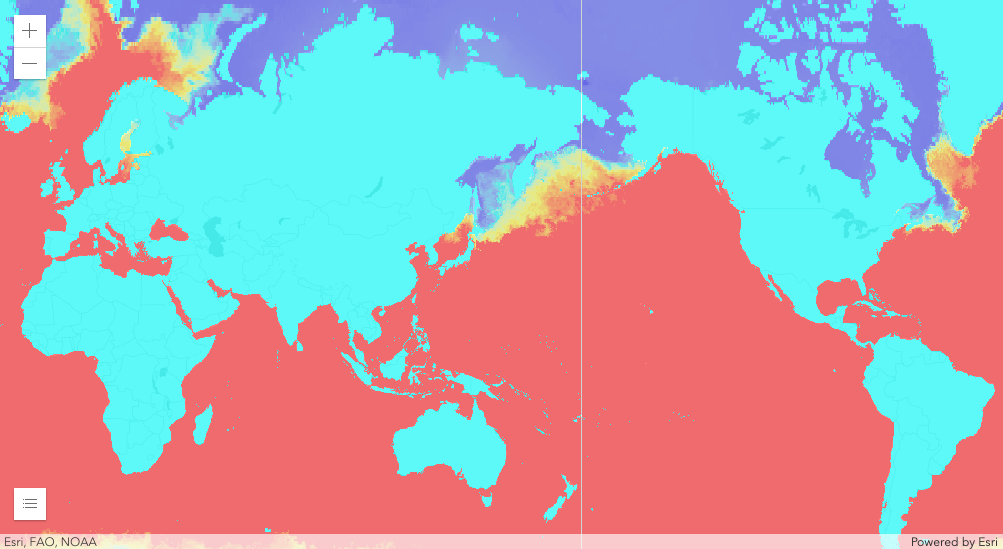
Blending-in is the new standing-out
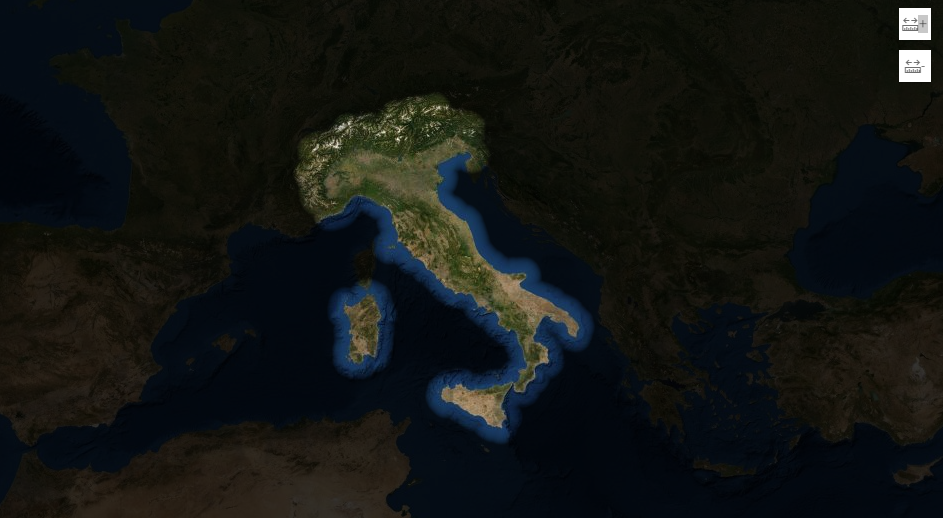
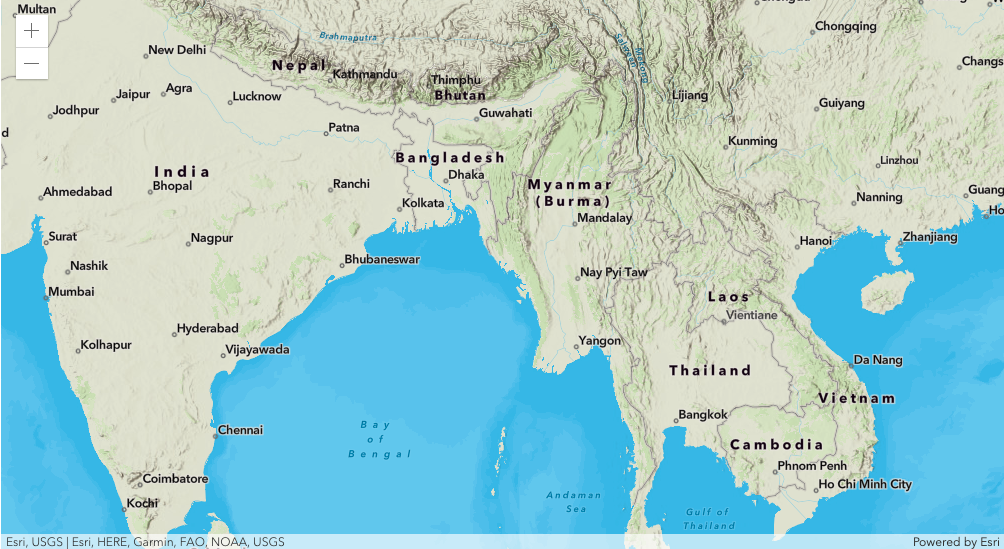
Ever wanted to combine one or more layers together to produce what looks like a new layer? Sounds cool, right? To accomplish this, we introduced a new capability called layer blending. This powerful capability allows you to apply blend modes to your layers to create striking visual effects.
https://developers.arcgis.com/javascript/latest/sample-code/?search=blendMode
Are you down with OGC?
Yeah, you know, me also. The OGC (Open Geospatial Consortium) API Feature standard is the successor to the OGC Web Feature Server (WFS) specification. And have we got a layer for you. The new OGCFeatureLayer, which works in 2D MapViews and 3D SceneViews, is better/stronger/faster than OGC WFS, and is now supported by the ArcGIS API for JavaScript.
https://developers.arcgis.com/javascript/latest/api-reference/esri-layers-OGCFeatureLayer.html
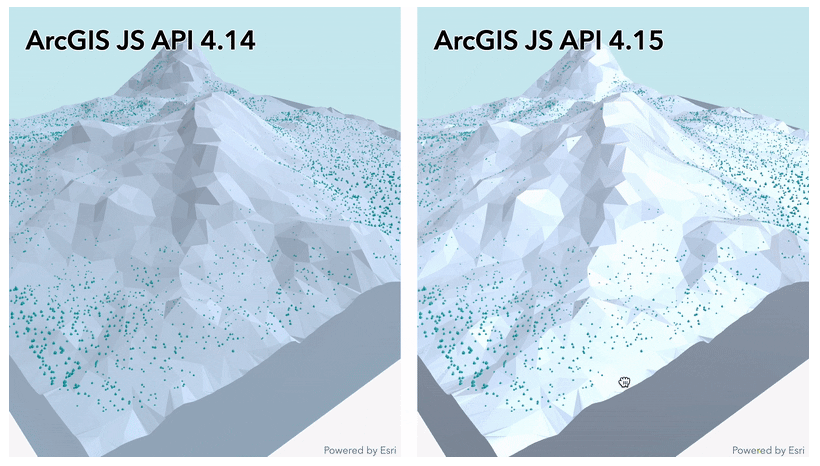
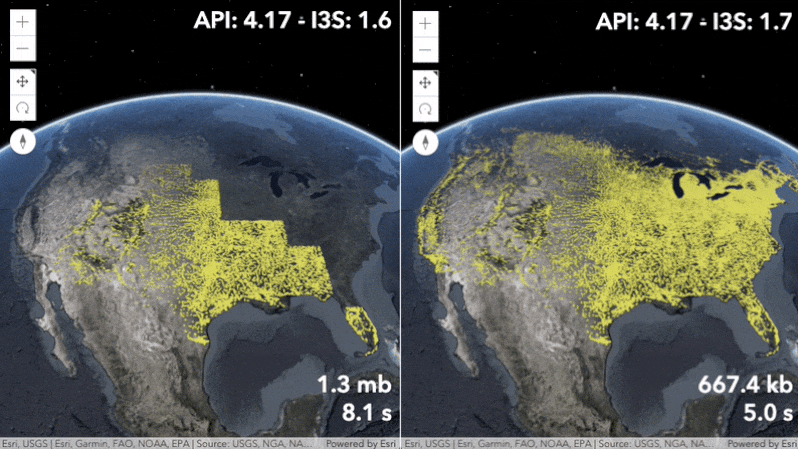
Self-evaluate your performance
At 4.15, we introduced a new SceneView.performanceInfo property to offer insight into the performance and memory consumptions of layers in your 3D scene. Now at 4.16, we’re ready to share this with the world. Heads-up: this property is experimental, prices and participation may vary, and can change at any time. But if you’re into performance metrics and 3D scenes, check out this new feature in your testing environments.
https://developers.arcgis.com/javascript/latest/sample-code/sceneview-memory/index.html
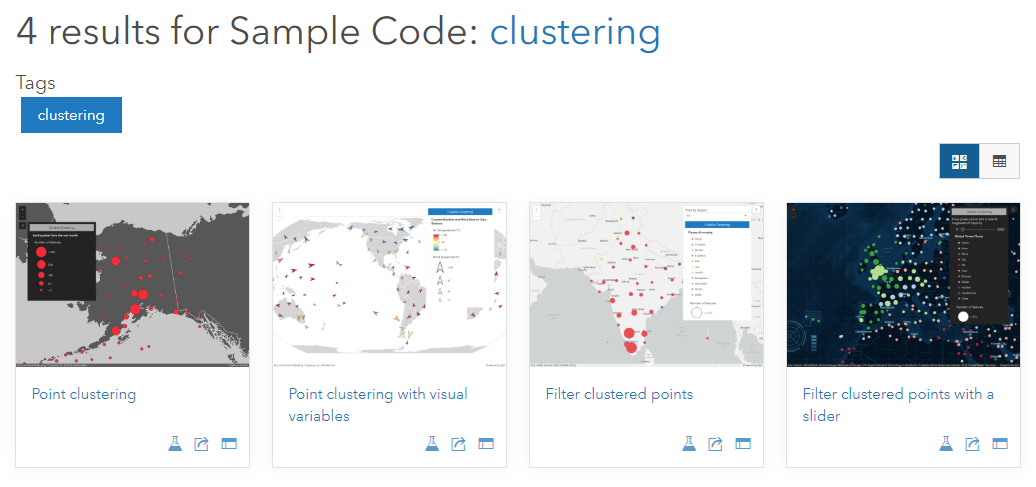
If you like labeling points, you may also like…
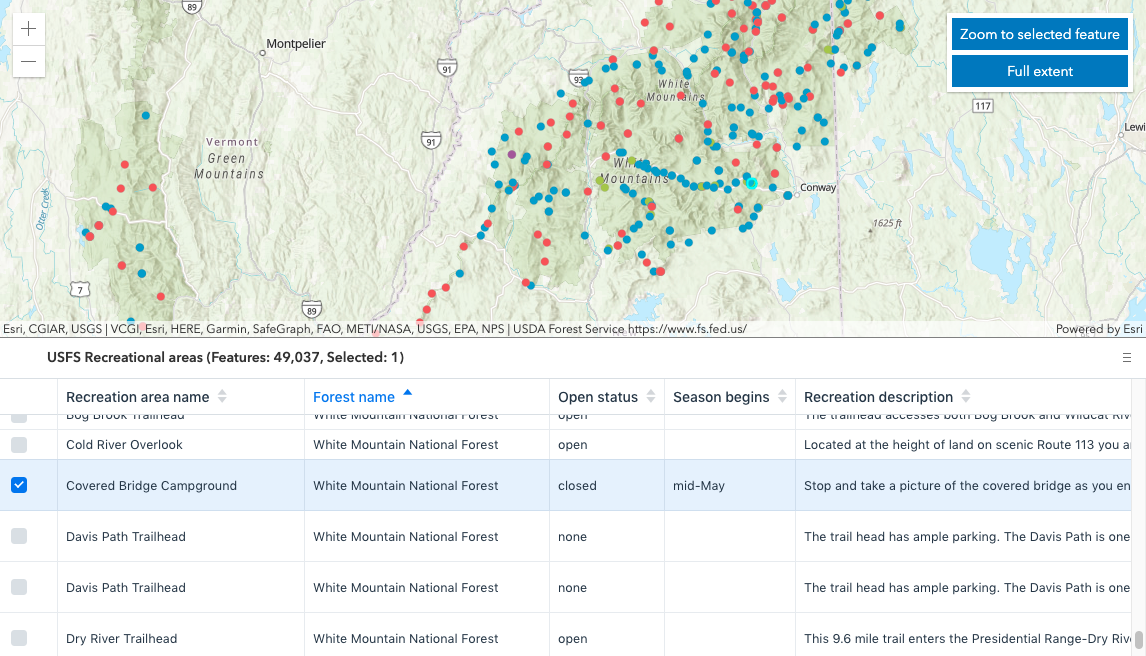
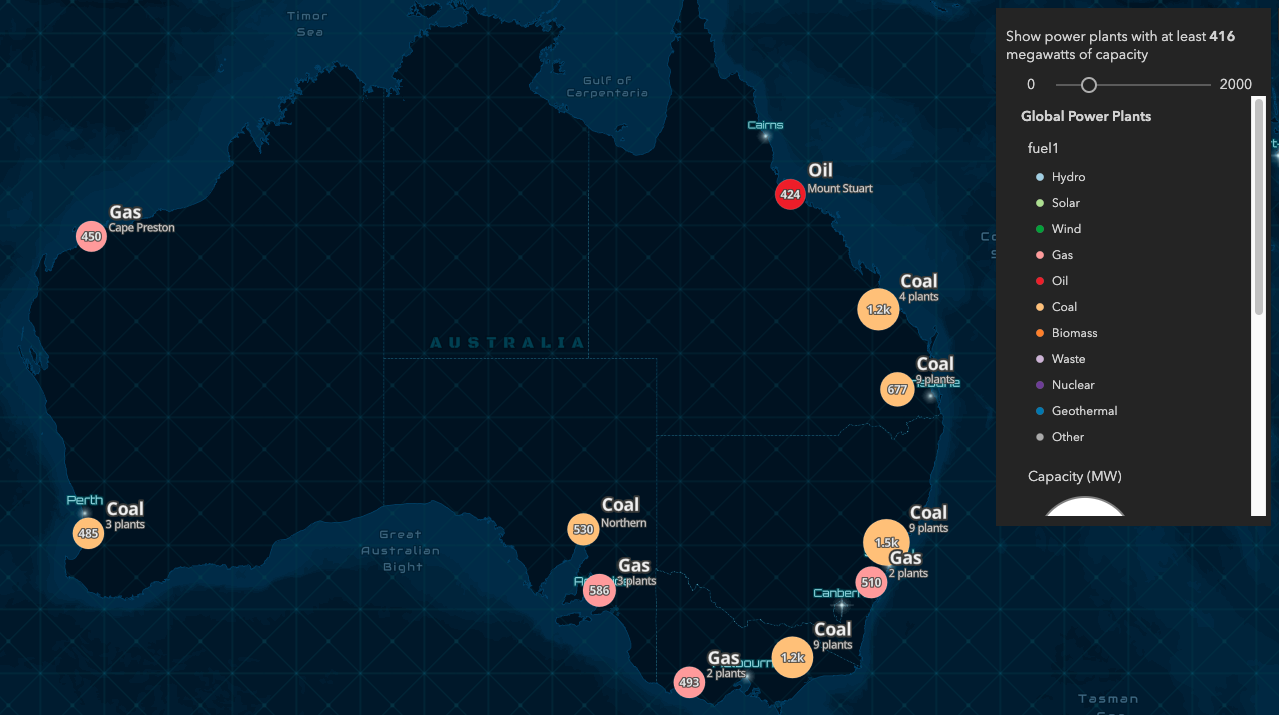
If you like labeling, you’ll love the new Honey Nut Clusters FeatureReductionCluster.labelingInfo property that allows you to label clusters based on count, or based on any summary statistics used by the cluster popup.
https://developers.arcgis.com/javascript/latest/sample-code/featurereduction-cluster-filter-slider/i...
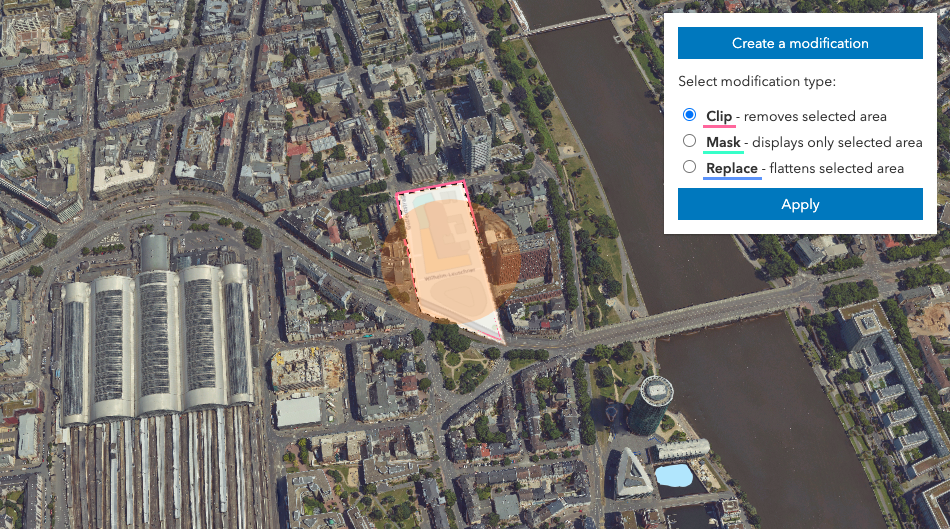
Client-side geometric modifications
Client-side geometric modifications (like clipping) on IntegratedMeshLayers in 3D SceneViews, are you serious?! Yes, very much so. With the SceneModifications class, you can now modify parts of an integrated mesh using polygon geometries. Focus on your areas of interest; ignore the noise.
https://developers.arcgis.com/javascript/latest/sample-code/layers-integratedmeshlayer-modification/...
CIM (/ˈsim/) seems (/sēmz/) cool (/ko͞ol/)
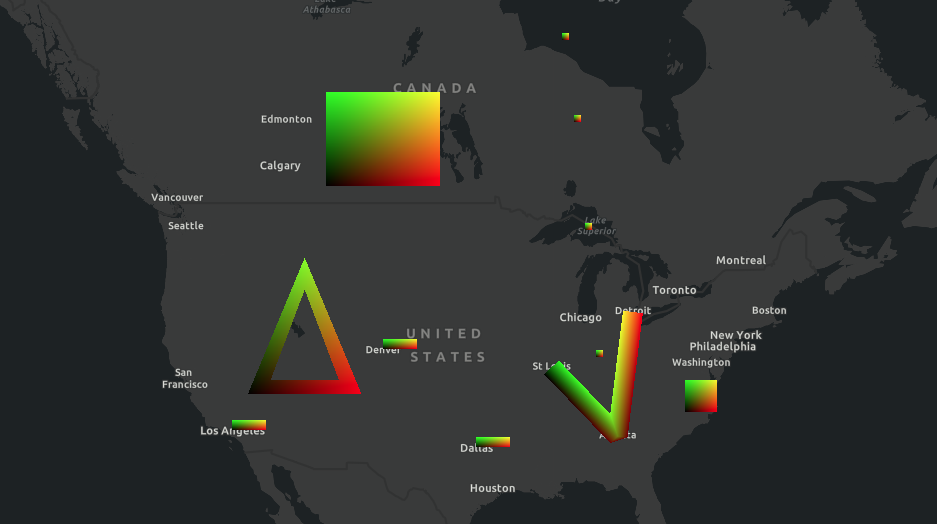
Remember, back in the day, when we released CIMSymbol for point features? Well, now you can do the same with lines and polygons in 2D MapViews. So create those custom symbols for all geometry types by using multiple symbol layers. And yes, you can print them just fine.
https://developers.arcgis.com/javascript/latest/sample-code/cim-lines-and-polygons/index.html
Reflecting pools for all
We enhanced the WaterSymbol3DLayer to reflect any 3D objects on water surfaces. The SceneView.environment property, which already has tons of options to make your 3D scenes even more beautiful and realistic, now has a fun waterReflectionEnabled property.
https://developers.arcgis.com/javascript/latest/sample-code/visualization-realistic-water/index.html
Wait, what’s that about seamless integration?
Oh yeah, thanks for the reminder. At every release we modernize the API. Fact. Sometimes we add things, sometimes we remove them. At 4.16, the API returns native promises by default. You can no longer opt-out with the handy has flag. We removed Dojo’s declare module, and pretty much stopped using Dojo altogether, although it’s still available with the CDN build. We also changed our will and stopped being supportive of multiple class inheritance, so start thinking about Accessor mixins. Read more here:
https://developers.arcgis.com/javascript/latest/guide/release-notes/#api-modernization
Wait wait, what’s next?
Do you enjoy the bleeding edge of technology? If so, ArcGIS API for JavaScript – next may be for you. We announced this new feature a couple of release ago, but since we’re all scrambling for things to do at home, this seems like an opportune moment to revisit. It’s basically a weekly-ish build of the next version (e.g. if the current release is 4.16, then next is based on 4.17) of the API that you can use, test, and create issues for if you are so inclined. Probably best to only use for testing as things can change whenevs.
https://github.com/Esri/feedback-js-api-next
Wait wait wait, there’s more!
Because we have so much fun “at the office” developing new stuff for you, we like to showcase our updates and answer any questions that you may have in-person. We do this a couple times per year at conferences like the Developer Summit and the User Conference.
If you missed us at the virtual Developer Summit this year, here is a blog about all the JavaScript presentation recordings:
https://www.esri.com/arcgis-blog/products/js-api-arcgis/announcements/arcgis-api-for-javascript-devs...
If you’re joining us for the virtual User Conference, here is a blog about all the exciting web development presentations and resources:
https://www.esri.com/arcgis-blog/products/js-api-arcgis/announcements/web-developers-guide-to-the-20...
And if you’re up on the news, you may find this blog about diversity, equity, and racial justice at the virtual User Conference especially relevant:
https://www.esri.com/arcgis-blog/products/product/announcements/diversity-equity-inclusion-racial-ju...
There is so much more that’s new and exciting at 4.16 and 3.33. Check out the links below to discover everything.
Release Blog
https://www.esri.com/arcgis-blog/products/js-api-arcgis/announcements/whats-new-in-the-arcgis-api-fo...
4.16 Release Notes
https://developers.arcgis.com/javascript/latest/guide/release-notes/index.html
4.16 Samples
https://developers.arcgis.com/javascript/latest/sample-code/?search=4.16
3.33 What’s New
https://developers.arcgis.com/javascript/3/jshelp/whats_new.html

.png)
.png)
.png)
.png)
.png)
.png)