ArcGIS JavaScript Maps SDK Blog - Page 8

cancel
Showing results for 
Show  only  | Search instead for 
Did you mean: 

Latest Activity

(85 Posts)
JamesMilner1
Deactivated User

Esri Polymer

This is a quick post to talk a little bit about Esri Polymer! It's a project I've been working on for a little while (very intermittently) but never put on GeoNet, so thought I would make this post!

Before I begin to start talking about the project I would like to point out what Polymer is. Polymer is a library from Google for building web components. It allows developers to create custom compartmentalised HTML elements. In a way you can think of a web component similar to a 'widget'. Some contrived examples might be a an image carousel, a YouTube video, or a PayPal checkout, or rather a <image-carousel> , a <youtube-video> and a <paypal-checkout>

Polymer provides a light wrapper around some native/polyfilled web standards that make up web components, namely:

  • Custom Elements - for defining a unique custom element
  • HTML Imports - for importing HTML
  • Shadow Dom - for encapsulating sub trees of DOM
  • HTML Template - for reusable inert pieces of DOM

The necessary polyfills come curtsy of webcomponents.js​ which allow web components to run on all modern evergreen browsers.

Great stuff James, but why would I ever want to use web components?

The major reason is that it allows us to write markup and code an abstracted level. You can import a web component into your page and mark it up in your HTML page just like you would a div or a span, or any other element without having to worry about the underlying implementation.

This works great with things like basemaps, web maps, feature layers, and markers. Each one of those becomes its own element, and we can have feature layers as child elements of a map add them to it.

For example:

<esri-map basemap="dark-gray" centerLng="-0.122" centerLat="51.514" zoom="7">

  <esri-featurelayer

          featurelayer="http://services.arcgis.com/Qo2anKIAMzIEkIJB/arcgis/rest/services/TubeMap/FeatureServer/2">

  </esri-featurelayer>

  <esri-marker lng="-0.5" lat="51.3">

  <esri-marker-title>Hello World</esri-marker-title>

  <esri-marker-content>Some Content</esri-marker-content>

  </esri-marker>

  </esri-map>

will produce the following once rendered:

Caveats

  • Web components are only supported with polyfills on modern browsers
  • Polymer is a relatively early stage project
  • Some argue that you shouldn't use web components in production

If you can live with these things than they are great fun to experiment with!

GitHub

You can find the project here: JamesMilnerUK/esri-polymer · GitHub

The Latest Version

I've just updated the project, hopefully with some certain niceties:

  • Polymer 1.1.5
  • ArcGIS JS 3.14
  • Cleaner code
  • Less hacky hacks for element lifecycles and interacting with parent and child elements

more
0 0 2,025
JamesMilner1
Deactivated User

It's been a while since I've posted anything to GeoNet, but I thought I'd share some samples that I was working on this weekend at Hackference to show case how to do some basic functions In ArcGIS. The repo has examples of how to do the first steps with the API, with code samples such as:

  • Creating a map
  • Creating a map from a Web Map ID
  • Adding markers (AKA Graphics, Points) to the map
  • Adding a Feature Layer to a map
  • Adding a CSV file to a map
  • Adding a KML file to a map
  • Creating a basic heatmap

These samples are meant to compliment some of the samples available from the JavaScript samples page​. There focus is on simplicity, commenting and on the bare minimum amount of code to do a requirement ('add a point to a map'). This is mostly useful for things such as teaching, hackathons and coding sessions with people completely new to the ArcGIS JavaScript API.

You can see the repo on GitHub here:

               JamesMilnerUK/ArcGISHelloWorld · GitHub   

               The Zip File

Got some simple,  commented, single function examples to add? Why not make a pull request!

more
0 0 1,476
AndyGup
Esri Regular Contributor

If you haven't had a chance to read up on what's coming in the next major release of the ArcGIS API for JavaScript v4, then it's time to get your game on and brush up on some of the exciting changes that can be explored today in v4 beta1. For those of you who haven't heard of this API or ArcGIS, we provide a large selection of APIs, SDKs, services, content and applications for building commercial mapping/geo-spatial applications. You'll want to check out the following:

  • The 4.0 API is currently in beta, so give v4beta1 a spin. This version of the API is a rewrite and it is fundamentally based on using JavaScript Promises. With these promise-based coding patterns you will be adopting a new and powerful architectural change in how you do JS app development.
  • Get a quick overview of Working with Promises (and the ArcGIS API for JavaScript).
  • Read about promises as guarantees in ArcGIS JavaScript Promises.
  • And, here's a great intro article from HTML5 Rocks simply called JavaScript Promises.

I promise to...?

Promises bring a whole new level of application life-cycle control to building web applications for use on mobile devices. In particular, there are two aspects of promises that will change how you do mobile development, forever: the ability to look back in time to see if some process has completed, and the ability to easily manage multiple, asynchronous requests.

In part 1 of this series we'll chat about how promises will allow you to verify after-the-fact and in a stateful way if an asynchronous action has completed successfully or failed. This is such an important concept that I'll illustrate it in a variety of ways to help push home the basics. All the examples are written for the ArcGIS API for JavaScript v4.x.

Absolutely yes these ideas work just fine on desktop apps. But desktop apps, in general, are significantly less susceptible to life-cycle issues as compared to mobile apps. Desktop web apps are tapped into dedicated internet connections with fairly reliable up times and connection speeds. In comparison, mobile web apps oftentimes easily suffer from small connectivity interruptions, hiccups and slowdowns. This can play havoc on your app while it's in the process of downloading and parsing HTML, CSS, JS and images as well as going through the initialization process. Promises can go a long way to smoothing out these potential speed bumps and towards helping you build consistent and stable applications without bending, breaking or stretching the basic rules of JavaScript best practices and sensibilities.

Promises, promises: the .then() pattern

All this magic works because promises have a built-in .then() mechanism that is your ticket to getting access to an asynchronous processes' state at any time whether it is still pending, if its completed or even if it failed. Simple in concept, powerful in execution. So, let's dig in.

We mention this several times in the ArcGIS API for JavaScript v4 documentation, the basic structure and concept of a promise looks like this:

someAsyncFunction.then(callback, errback);

A related side note, until the ECMAScript 2015 Promise standard is fully adopted and integrated by the various browser vendors, some third party libraries may provide slightly different syntax than what is shown in this post, but the concepts should all generally lead to the same result.

Below is a slightly exaggerated code snippet of how the concept works, and for a fully working version check out this jsbin. In this sample, a timer forces the code to wait for 5 seconds before calling view.then(). If you run the jsbin with the developer console window open you'll see the map has already loaded and should be visible by the time "View is ready? true" gets written to the console. The point here is that the SceneView's promise did, in fact, let us query its state well after the map and view were initialized.

     map = new Map({
          basemap: "streets"
     });

     view = new SceneView({
          container: "viewDiv",
          map: map,
          scale: 240000000
     });
            
      // Let's wait for 5 seconds
      setTimeout(function() {
           view.then(function(viewEvt){
                console.log("View is ready? " + viewEvt.ready);
           });
      }, 5000);        

Huh, how does this benefit me? I still don't get it.

Hang in there, we have a few more examples to look at. The above example demonstrates that the promises pattern truly lets you de-couple the timing on when you execute various aspects of your code. It means you can access the state of an asynchronous process at any time and anywhere in your application, even after the process has long been completed. It gives you another excellent tool in your coding toolkit for going several steps beyond what's possible with using only event listeners and callbacks.

The most important benefit of this pattern for mobile development, or really for any JavaScript development, is you can delay asking for a promise if you need to wait for other asynchronous or synchronous processes to complete first. You can't delay an event listener and it's bad, bad practice to place timers in callbacks. Promises give you a scalpel for exerting significantly greater control over application logic flow than was ever possible before with simply using event listeners and stand-alone callbacks by themselves.

Okay, so how's this different than events and event listeners?

The promise-based .then() pattern offers a significant advantage over the tried-and-true, events-based coding pattern. JavaScript event messages are similar to bullets; once they are fired they are gone forever and you can't bring them back. Once an event has fired you can't get it back, and it only hangs around for a very short period of time as it bubbles its way up through various layers of JavaScript and then it's gone. Poof.

What this means is if you initialize an event listener in your app after an event has already occurred then the event listener will never fire. Period. It will simply wait faithfully for eternity and pretty much do nothing.

Here's a snippet to demonstrate the concept of an event listener created after-the-fact and will never fire. You can also check it out live in a jsbin version.


            map = new Map({
                basemap: "streets"
            });

            view = new SceneView({
                container: "viewDiv",
                map: map,
                scale: 240000000
            });            


            view.then(function(viewEvt){

                console.log("View is ready? " + viewEvt.ready);

                //Event listener is initialized after the event has occurred!
                map.on("load", function(){
                    // This will never fire!
                    console.log("Map loaded via event listener!");
                });

                console.log("The map already loaded? " + map.loaded);

            });           

Yes, this snippet is an oversimplification to help clarify how event listeners can easily cause life-cycle issues, and I'm definitely not implying that all event listeners are bad. The point is that it's very easy in large JavaScript applications to initialize an event listener too late in the life-cycle for it to ever fire properly. What's happens next is you troubleshoot and wonder for hours why your code isn't working properly, or why it may only work intermittently.

In mobile web applications, this simple concept is perhaps one of the most common reasons for intermittent failures!

What happens if you swap an event listener for a promise?

This next sample demonstrates swapping out the failed event listener pattern from the previous example with a promise-based pattern. Here's the jsbin for this sample. As you migrate existing applications, you'll be going through similar steps.

There is also an important twist in this sample that steps away from simply checking if the map.loaded boolean is true or false and then continuing with code execution. With the promises-based pattern we can inspect the promises' callback object and verify, among other things, if the process completed successful or if it failed and why.

We always have access to the promise associated with map, and we can access it at any time and anywhere in our application.


            map = new Map({
                basemap: "streets"
            });

            view = new SceneView({
                container: "viewDiv",
                map: map,
                scale: 240000000
            });

            view.then(function(viewEvt){
                console.log("View is ready? " + viewEvt.ready);

                   map.then(function(mapEvt) {
                        console.log("The map already loaded? " + mapEvt.loaded);
                    }, function(mapErr){
                        console.log("Was there any map load errors? " + mapErr);
                    });

                console.log("The map already loaded? " + map.loaded);
            });           

So, let's take this one step further and ask for the map.then() promise after a 5 second timer run. This is similar to what we did with the event listener above, and the purpose is to simulate asking for the promise at some point signfiicantly later in the application life-cycle than the process occurred. The big difference is this pattern will, in fact, be successful because the promise maintains state! Try modifying the above sample in jsbin and try it out yourself.


            map = new Map({
                basemap: "streets"
            });

            view = new SceneView({
                container: "viewDiv",
                map: map,
                scale: 240000000
            });

            view.then(function(viewEvt){
                console.log("View is ready? " + viewEvt.ready);

                setTimeout(function() {
                    map.then(function(mapEvt) {
                        console.log("The map already loaded? " + mapEvt.loaded);
                    }, function(mapErr){
                        console.log("Was there any map load errors? " + mapErr);
                    });
                }, 5000);

                console.log("The map already loaded? " + map.loaded);
            });           

Closing thoughts

There is a learning curve associated with promises, and they aren't perfect. However, hopefully this post has helped you understand just a little bit more about the value that promises can provide. As you consider the possibilities, you might start to rethink how you architect applications and that is a good start to continuously improve what we create!

Promises, callbacks and event listeners all still have important roles play depending on the unique requirements for the applications we build on a daily basis. In fact, many people overlook or ignore the fact that a promise does indeed include its very own callbacks to indicate if the process completed successfully or if it failed.

As you start to migrate existing applications to the promises pattern you may find yourself mixing-and-matching promises, callbacks and event listeners as you go through the process of reinventing your architecture. This is all part of the normal progression as new architectures gradually take over the old. And, as you build new applications from scratch you'll get to try your hand at a fresh approach.

Try these samples out, check out the ArcGIS API for JavaScript v4 samples and hopefully have fun learning the latest and greatest that is available in JavaScript!

[Minor edit - Aug 10, 2015 to read as 'any' async request!]

more
6 4 5,098
JamesMilner1
Deactivated User

Recently I came across an article that had used the GitHub API to scrape information regarding the number of users in major cities in the US. The article gave me the idea to take this a little further and see if we could map out the number of users in each city, or perhaps more importantly the percentage of people in that city with a GitHub accounts. Before we begin let met point out the obvious flaws with the methodology of this application:

  • Populations are estimations (plus the UK census is now 4 years old)
  • Populations for cities can be difficult to define (city, urban, metro area)
  • GitHub accounts can be owned by companies as well as people
  • Not everyone gives their location on their GitHub accounts, or people may lie/not update

Having said this, it's still interesting to explore the available data and try to see or explain any patterns. Plus it's fun!

Data Scraping

Firstly to get the data into a format that could be mapped, it was necessary to instantiate a list of cities that I was interested in, and assign these their populations (I used Wikipedia).

Then using Python and the GitHub API I scraped the number accounts that matched the town name. Here it was necessary to try multiple different matches to get an accurate data. For example, with London it was necessary to try "London, England", "London, Great Britain", "London, United Kingdom" and "London, UK" as these are all valid locations representing the same place. You will need a GitHub account and a token to avoid rate limiting.

The Results


CityGitHub AccountsCity PopulationRate
Cambridge, England13131285151.022
Brighton, England5881630000.361
Oxford, England5511713800.322
Bath, England231888590.260
Reading, England2911608250.181
Durham, England68480690.141
Bristol, England8376170000.136
York, England2602044390.127
Norwich, England1651404520.117
Edinburgh, Scotland8017820000.102
London, England929197874260.095
Glasgow, Scotland5585899000.095
Dundee, Scotland1331539900.086
Exeter, England981218000.080
Belfast, Northern-Ireland2162767050.078
Bangor, Wales11163580.067
Aberdeen, Scotland1251891200.066
Cardiff, Wales2834472870.063
Bournemouth, England1161834910.063
Sheffield, England3626407200.056
Nottingham, England3897299770.053
Liverpool, England2364664150.051
Manchester, England129125533790.051
Plymouth, England1222566000.048
Swansea, Wales1012390230.042
Newcastle, England3518799960.040
Southampton, England3128555690.036
Inverness, Scotland21579600.036
Leicester, England1435090000.028
Leeds, England49617779340.028
Gloucester, England291256490.023
Warwick, England291393960.021
Birmingham, England50324409860.021
Newport, Wales261457000.018
Derry, Northern-Ireland6836520.007
Aylesbury, England131845600.007
Lisburn, Northern-Ireland4714030.006

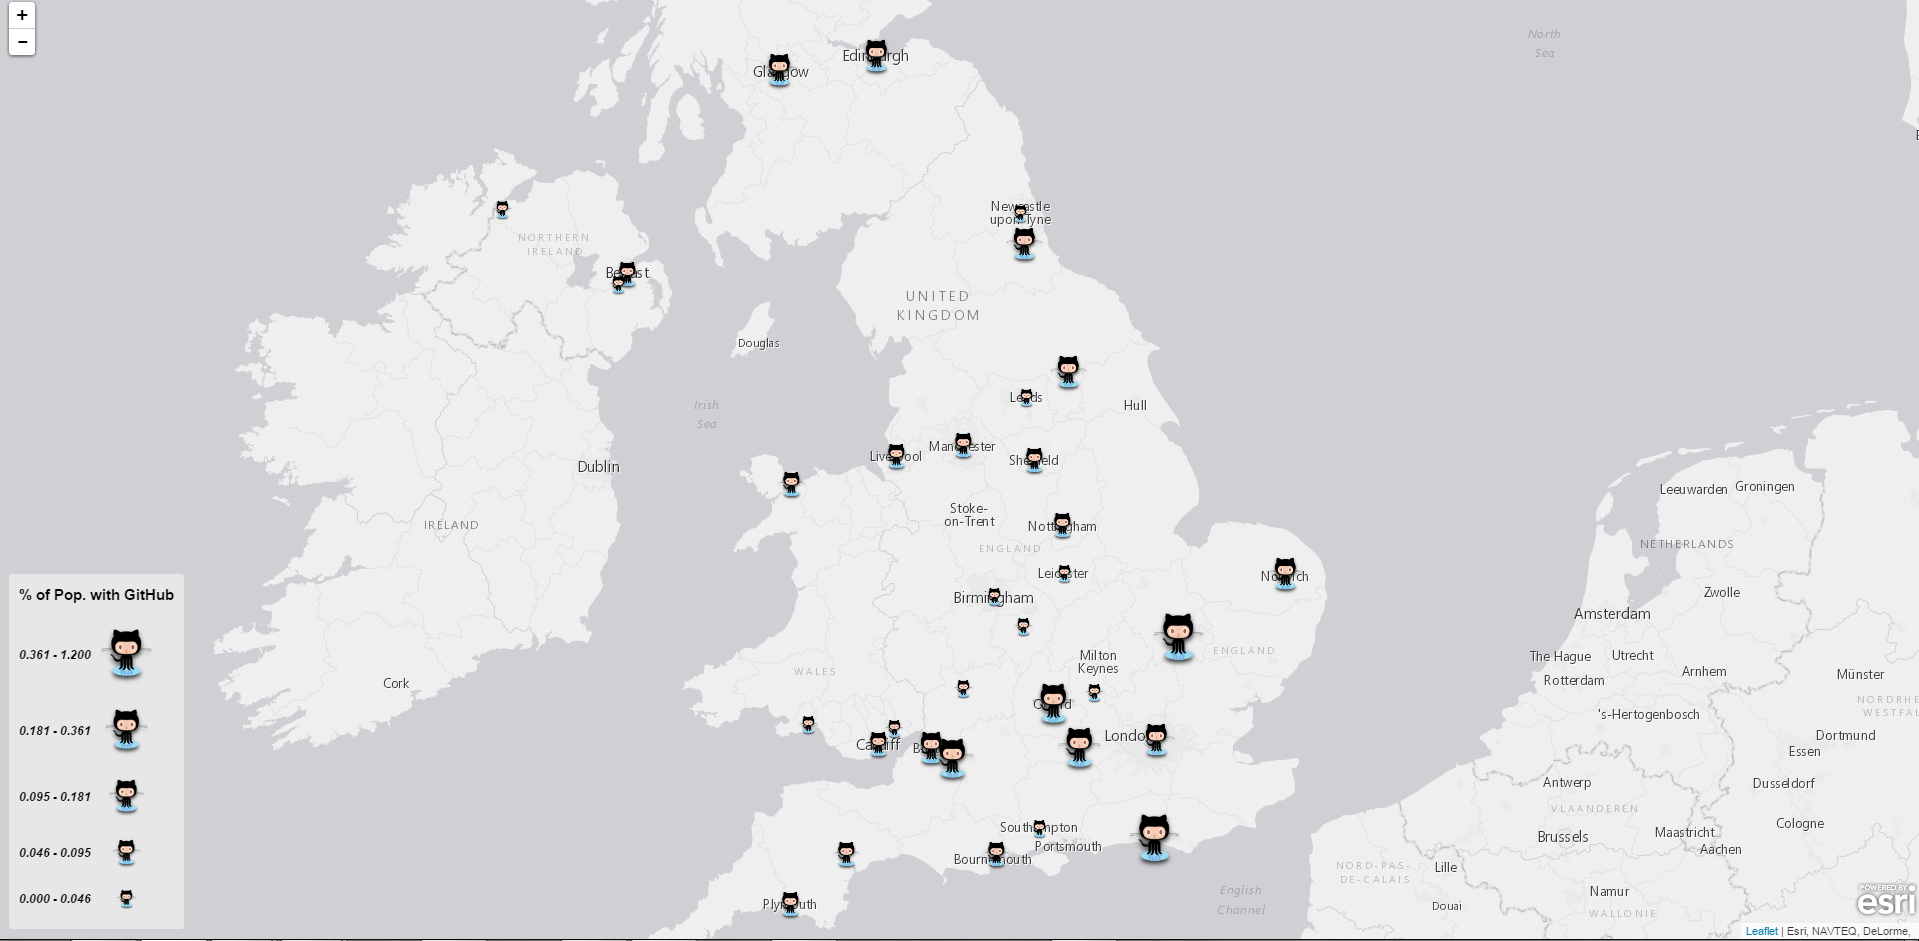
We can see highest on the list is Cambridge with over 1 % of the population having a GitHub account. Lowest on the list was Lisburn with 0.006 closely followed by Aylesbury (where I live ) and Derry with 0.007%. To put this into perspective the original Hirily analysis found 3% of San Francisco's population had a GitHub account!
Making the Map

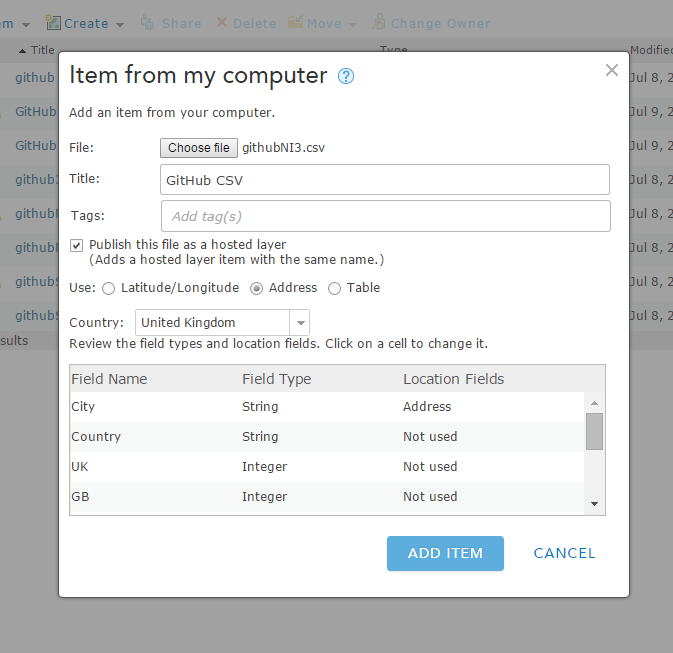
The script outputs a CSV which was then uploaded into ArcGIS Online content pane using a developer account. When uploading the CSV we can set the city column to be geocoded. This allows us to take the address of the city and turn it into a latitude and longitude, in turn allowing us to map the data.

githubcsv.png

The process asks if you want to review (probably worth while as some points can end up astray). Once this was done, I gained a Feature Service of the data (a REST end point we can get our data from). From here I took this into a Esri Leaflet map (one of Esri's GitHub projects!). The main bulk of the mapping is outlined in the JavaScript code below:

    var map = L.map('map').setView([ 54.514, -2.122], 6);

    L.esri.basemapLayer("Gray").addTo(map);
    L.esri.basemapLayer("GrayLabels").addTo(map);


    var ukGitHub =
    "http://services1.arcgis.com/Q6SkXeZHDxVxhXA4/arcgis/rest/services/GitHub_Data/FeatureServer/0";
    var gh = L.esri.featureLayer(ukGitHub, {
        pointToLayer: function (geojson, latlng) {
            console.log(geojson);
            var rate = geojson.properties.Rate;
            var size;


            if (rate >= 0.361 && rate < 1.2 ) {
                size = [65, 63];
            }
            else if (rate >= 0.181 && rate < 0.361 ) {
                size = [55, 53];
            }
            else if  (rate >= 0.095 && rate < 0.181 ) {
                size = [45, 43];
            }
            else if  (rate >= 0.046 && rate < 0.095 ) {
                size = [35, 33];
            }
            else if  (rate >= 0 && rate < 0.046 )  {
                size = [25, 23];
            }


            return L.marker(latlng, {
                icon: L.icon({
                    iconUrl: 'imgs/github4.png',
                    iconSize: size,
                    iconAnchor: [size[0] / 2, size[1] / 2],
                    popupAnchor: [0, -11]
                })
            });
        }
    }).addTo(map);

Screenshot and Live Demo

A screenshot of the map can be seen below, a live demo can be seen here.

githubmap.png

Where's the code?

You can find the code on my GitHub account: JamesMilnerUK/github-mapping · GitHub 

set the city column to be geocoded. This allows us to take the address of the city and turn it into a latitude and longitude, in turn allowing us to map the data.

more
0 3 6,476
JamesMilner1
Deactivated User

What is it ?

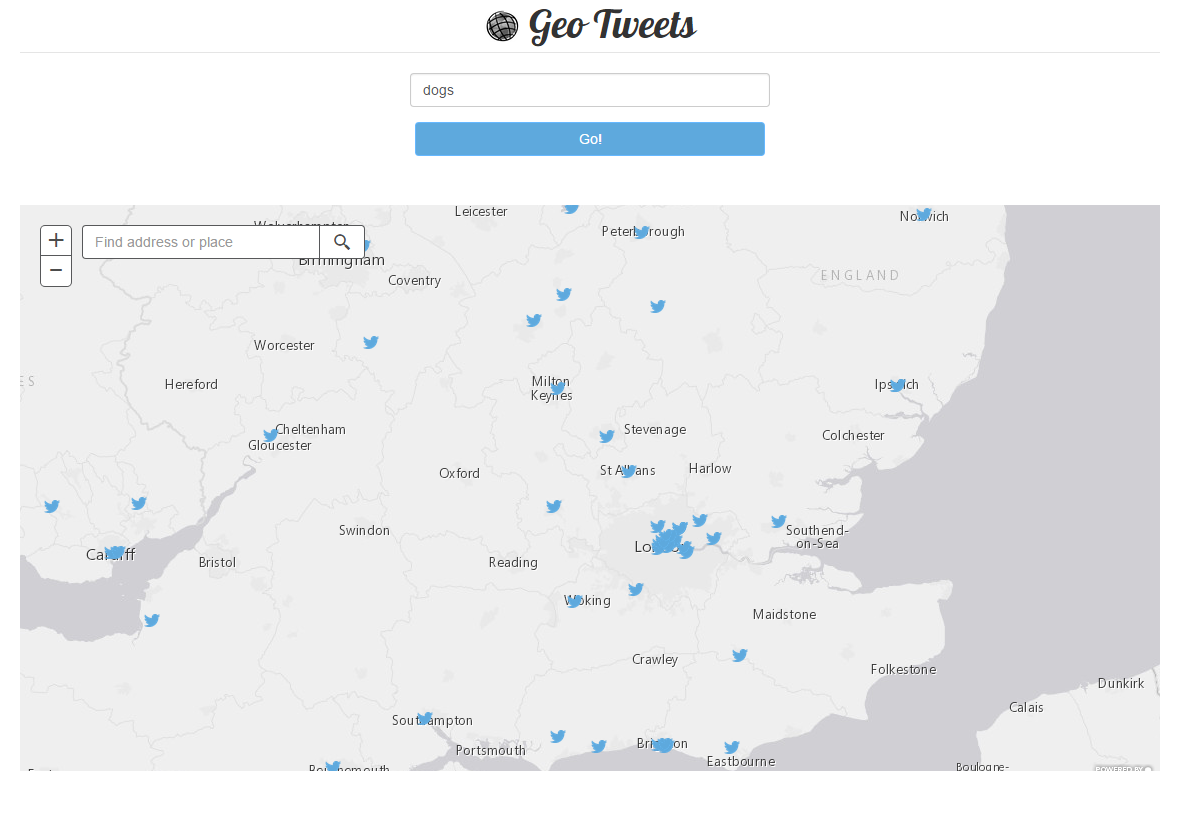
A simple map that allows users to search for tweets referring to a specific keyword in a given view extent. Currently the Twitter search API only allows you to pull back a maximum of 100 tweets, but it gives you a flavour for what you might be able to do if you had/have access to the Twitter firehose! The application also demonstrates how to do common tasks you might do in jQuery via Dojo. For example DOM querying, styling and AJAX using the requests module. This allows us as developers to not have to import an extra library whilst using the ArcGIS JavaScript API, reducing page weight.

What does it look like?

Live Demo

You can see the live demo at by following the link here. The Twitter API is rate limited so there is some possibility that the auth credentials used may hit their allocated limit.

GitHub Repository

The project is available from: https://github.com/JamesMilnerUK/esri-twitter

The Twitter Search API

The Twitter search API is defined here. The API allows users to get hold of tweets although it is important to note:

"[the] Twitter’s search service and, by extension, the Search API is not meant to be an exhaustive source of Tweets. Not all Tweets will be indexed or made available via the search interface. "

So, not suitable if you are looking for a full picture, but still useful for a bit of fun mapping tweets. An alternative if you need an exhaustive list of tweets may be to examine companies with Twitter Firehose access; for example Gnip (recently bought by Twitter) and DataSift (although their access appears to be ending in August 2015).

The Twitter Search API requires authentication. You can register a new app which will provide you with the authentication credentials required at Twitter Application Management. Once you have registered you can get hold of four things:

  • Consumer Key (API Key)
  • Consumer Secret (API Secret)
  • Access Token
  • Access Token Secret

From here I found the easiest way to get going with the API without having to worry about authentication implementation details was to use a helper library. In this case I've used TwitterAPIExchange (PHP) by J7mbo, but it appears there is a node.js module and also a Ruby Gem depending on how you roll.

The Twitter Search API has a few parameters that we are specifically interested in, in this case, geocode and count. Geocode represents a latitude, longitude (note the order!) and radius that we are interested in returning tweets from (km or miles are accepted as units). In the case of this application we use the centre point of the map and then get the extent in kilometres divided by two as the radius. For the count we keep this capped at 100, as this is the maximum!

Frontend and ArcGIS JavaScript API

We firstly check if HTML5 geolocation, if so then we instantiate a map at that part of the the world using the provide coordinates. If not then we instantiate a map near the middle of the Earth (0, 30) at a reasonable zoom level (8).  We also provide the user with a box to provide the keyword we are looking for. We then do an AJAX request to the PHP script 'gettweets.php'. As mentioned we pass it the latitude, longitude, radius and the Twitter keyword we're interested. This is returned back to our map, and we create a graphic for each of the tweets at its geotagged location (from the geo object of the Twitter API JSON payload). We do this using a PictureMarkerSymbol and also a suitable InfoTemplate with the users avatar, the content of the tweet and the date (again from the payload). The layout uses Bootstrap to allow for a responsive design that is suitable for most devices. We also make use of the Search widget, to allow for simple location finding for users.

Where could this be taken?

You (or I for that matter!) could go on to compare how different tweets compare geographically, go on to use a heatmap renderer or cluster layer to explore distribution better (may be a little redundant with the 100 tweet limit however). Alternatively if you have Twitter firehose access it might be easy to switch out the API.

Other things that might interest you

more
2 0 5,608
JamesMilner1
Deactivated User

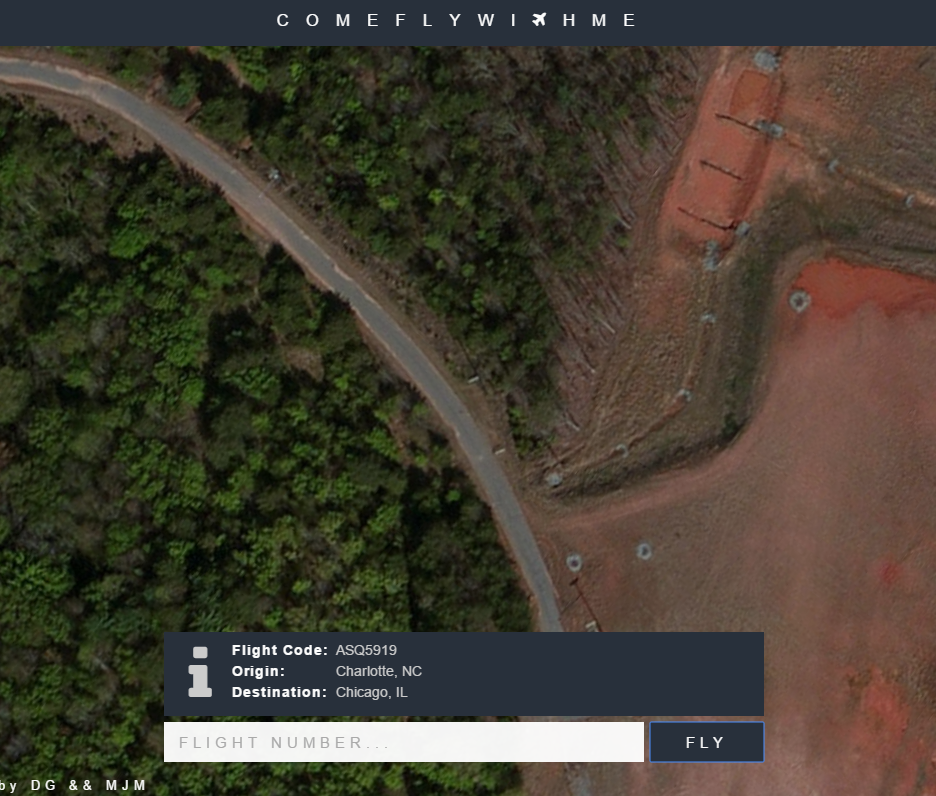
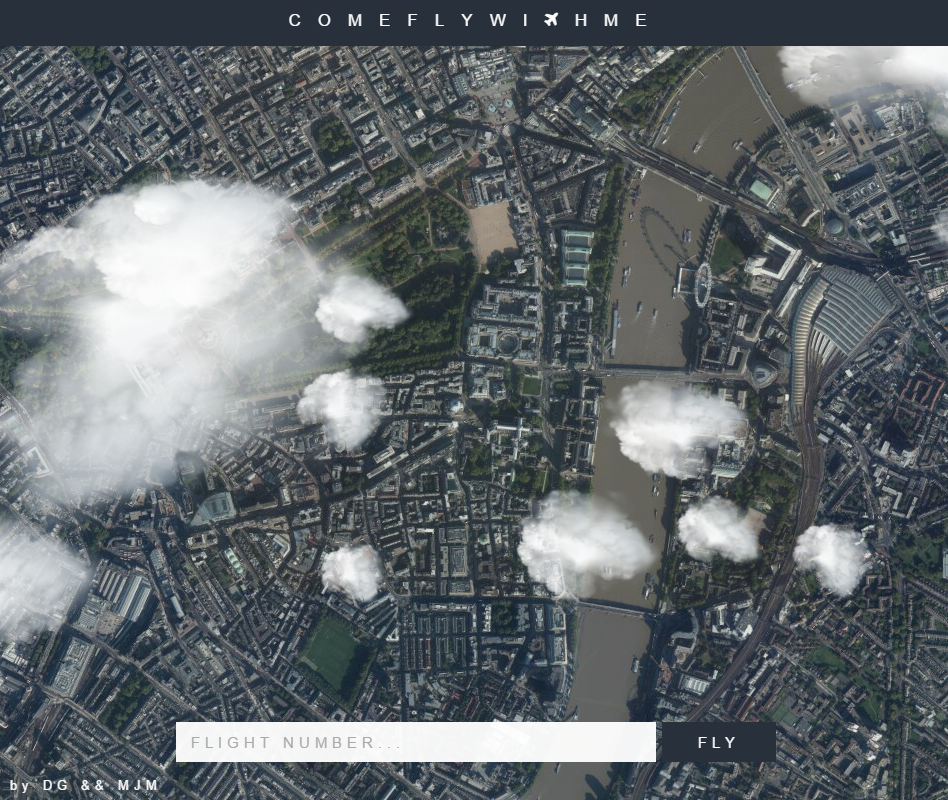
ComeFlyWithMe is an application built by two university students Max Maybury and Darren Gilbert. It allows you to see what's directly underneath a flight at any given any point in time, using a combination of the ArcGIS JavaScript API and the the FlightAware API. The project started at SpaceApps London, held at Inmarsat.

ComeFlyWithMe1.png

Max:"We were provided with a list of challenges that we could pick from, and we chose one where the challenge was to provide the user with a view from a plane. We had a few ideas to use Google Earth, but found the API didn't really exist, so we just decided to integrate Google Maps, and move the map to represent the movement of the plane. We use the altitude of the plane to affect the zoom of the map, so that the map becomes more zoomed in as the plane begins its descent."

But they didn't feel like this application was enough to wow the judges, so they began to look deeper. They started thinking about how they could make the app more realistic and visually appealing, look to the plugin free web graphics library WebGL.

Max: "[we started to] look into the weather, and how we could represent that on the screen. We use WebGL to dynamically generate cloud coverage, based on a percentage we get from a weather API. We also add a filter for flights which are flying through the night.

ComeFlyWithMe2.png

After the event, we realised that the maps that Esri provide are better quality, so we decided to integrate them into the system. We had a few problems which we had overcome here, trying to find out if the zoom levels of the Esri maps differ from Google Maps, and how we could render the map more quickly. We removed the pan duration, pan rate, zoom duration, and zoom rate, when we initially set the centre point of the map. This meant that the map loaded a lot quicker when a flight was entered.

We used the Flight Aware API to get more accurate location information for the flights. We didn't want to call the API too much, as this would slow the server down a lot, so we wrote our own calculations for the flight path based on the bearing of the plane, and the speed it was travelling at. We called the flight API every minute or so, so that it could fix its position. The website uses Node.js in the backend, with WebGL and the Esri maps API in the front end.""

Max and Darren won the People's Choice Award at SpaceApps London, with the judges citing that "Come Fly with me was the best example of a fully working demo after 24 hours and something we could see airlines being interested to show where you are in flight in as well as friends / family interested in where loved ones are currently mid flight."

ComeFlyWithMe3.png

They also exhibited the app at the Inmarsat booth during the Esri UK Annual Conference on May 19th at QEII in Westminster, London, where Inmarsat was showing off innovative use of flight location data. In the future they see opportunities to feature the flights on  in-flight entertainment systems, so that users can find out more about where they are travelling over. They state that this could also lead all sorts of additional exciting data being overlaid onto the surface imagery.

If you are interested in the code you can check out its GitHub account here: https://github.com/DMJGilbert/comeflywithme

more
1 1 3,320
JamesMilner1
Deactivated User

As most starters to the ArcGIS JavaScript API, I had to start getting to grips with Dojo. I will make a bit of a concession in saying I've put off learning Dojo but I have been feeling recently that is a necessity to use the JS API to its full potential and avoid bring redundant code. I'll be going back to remove jQuery from some of my examples over the coming months. Apart from it being unnecessary in conjunction to Dojo, jQuery also adds page weight and subsequently wastes of bandwidth and increases page load times. The vast majority of things jQuery does, Dojo can also do. I've been digging into Dojo (there docs are now beautiful!) that I realised it was no way near as 'hard' or 'verbose' as people were making it out to be. In fact when it comes to DOM manipulation and traversal, it's more or less identical to jQuery in most scenarios.

Lets assume we have the following set of very basic HTML in our web page:

<div class="box red">
    <p id="one">1</p>
    <p id="two">2</p>
    <p id="three">3</p>
</div>
<div class="box blue">
    <p class="letter">a</p>
    <p class="letter">b</p>
    <p class="letter">c</p>
</div>

Here's how we might go around selecting elements using jQuery:

     var jQueryOne = $("#red");
     var jQueryRed = $(".red");
     var jQueryRedAndBlue = $(".red .blue");

But realistically this is also trivial using Dojo:

// We're using dojo query
require(["dojo/query", "dojo/domReady"], function(query){

    //query methoods - http://dojotoolkit.org/reference-guide/1.10/dojo/query.html 
    var dojoOne = query("#one");
    var dojoRed = query(".red");
    var dojoRedAndBlue = query(".red .blue");
    var dojoQueryChildren = query(".red >"); // This will return children of .red

});

Notice that there is essentially no difference in the code structure (minus AMD module loading; we load 'query' for DOM selection and domReady to wait until the DOM has loaded). Dojo also returns a NodeList,​ which is essentially a JavaScript Array of the selected DOM elements, decorated with helper functions.

But what if we want to begin to traverse the DOM? In jQuery you may be used to doing something like:

    // https://api.jquery.com/category/manipulation/
    var jQueryChildren = $(".red").children();
    var jQueryParent = $("#one").parent();
    var jQueryParents = $("#one").parents();
    var jQuerySiblings = $("#one").siblings();
    var jQueryNext =  $("#one").next();

And so forth.   Again using Dojo this is actually very similar and simple:

require(["dojo/query", "dojo/NodeList-traverse", "dojo/domReady!"], function(query){
     //NodeList-traverse methods
    var dojoChildren = query(".red").children();
    var dojoParent = query("#one").parent();
    var dojoParents = query("#one").parents();
    var dojoSiblings = query("#one").siblings();
    var dojoNext =  query("#one").next();
    // Full list of traversals here: 
    // http://dojotoolkit.org/reference-guide/1.10/dojo/NodeList-traverse.html 
});

Again notice that the implementations are very similar. This time we loaded in NodeList-traverse as well as query.

Another aspect of dealing with the DOM is wanting to hide, show, style and destroy DOM elements (and such things). In jQuery we may do something like this:

    $("#one").css("color", "orange"); // Change the css color to organge
    $("#two").remove(); // Here for similar methods: https://api.jquery.com/remove/
    $(".blue").removeClass(); // Will remove the blue background color
    $("#one").hide(); // Hides the element
    $("#one").show(); // Shows the element again

You can achieve the same affect using:

    query("#one").style("color", "orange");
    query("#one").remove();
    query(".box").removeClass(".blue");
    query("#one").style("visibility", "hidden");
    query("#one").style("visibility", "visible");

If you ever want to iterate over a returned list of DOM nodes in Dojo you can dojo.forEach ​(allows forEach functionality from ES5 in older browsers also). In jQuery you can use $.each​. Another solution is just to use a native for loop:

for (var i = 0; i < someNodes.length; i++) {
     console.log(someNodes);
}

You can see the full example here on this gist: jQuery to Dojo.html

Hopefully this post as evidenced how simple it is to switch out your jQuery without any real detriment to your code or readability! I'll be doing another couple posts on how to convert your jQuery code; one on AJAX calls another on animations.

Additional Resources:

more
3 1 3,246
AndyGup
Esri Regular Contributor

Many folks are starting to notice a warning message in the latest versions of Chrome when running apps that use the browser's JavaScript Geolocation API. The warning says "getCurrentPosition() and watchPosition() are deprecated on insecure origins, and support will be removed in the future. You should consider switching your application to a secure origin, such as HTTPS. See https://goo.gl/rStTGz for more details."

There are several things to know about this message. You will still be able to test Geolocation locally on Chrome without needing to install a security certificate on your development machine when using patterns such as "localhost", "web.local", "192.168.x.x" and similar since they are considered Potentially Trustworthy. Additionally, if you are using blob:, file: and filesystem: URLs they will also continue to work as long as they were created in a potentially secure origin themselves. However, if you have apps that use data: and javascript: then those origins are not considered potentially secure and will most likely be blocked.

Chrome and Google have been consistently sending a message that the web needs to continue moving towards HTTPS for all traffic. It's reasonable to assume that at some point in the near future Chrome (as well as other browser vendors) will require a location-based JavaScript app hosted on a public-facing, production server to be served up via HTTPS.

Additional Reading

Google Web Security Group: Google Groups

The Chromium Projects: Prefer Secure Origins For Powerful New Features - The Chromium Projects

W3C: Secure Contexts

more
4 23 16.1K
JamesMilner1
Deactivated User

Alongside the Twilio, I've recently been exploring a few other interesting APIs to make use of in projects. One of which is the Soundcloud API. For those of you who are unfamiliar Soundcloud is a platform for people to share music they've made with other users.

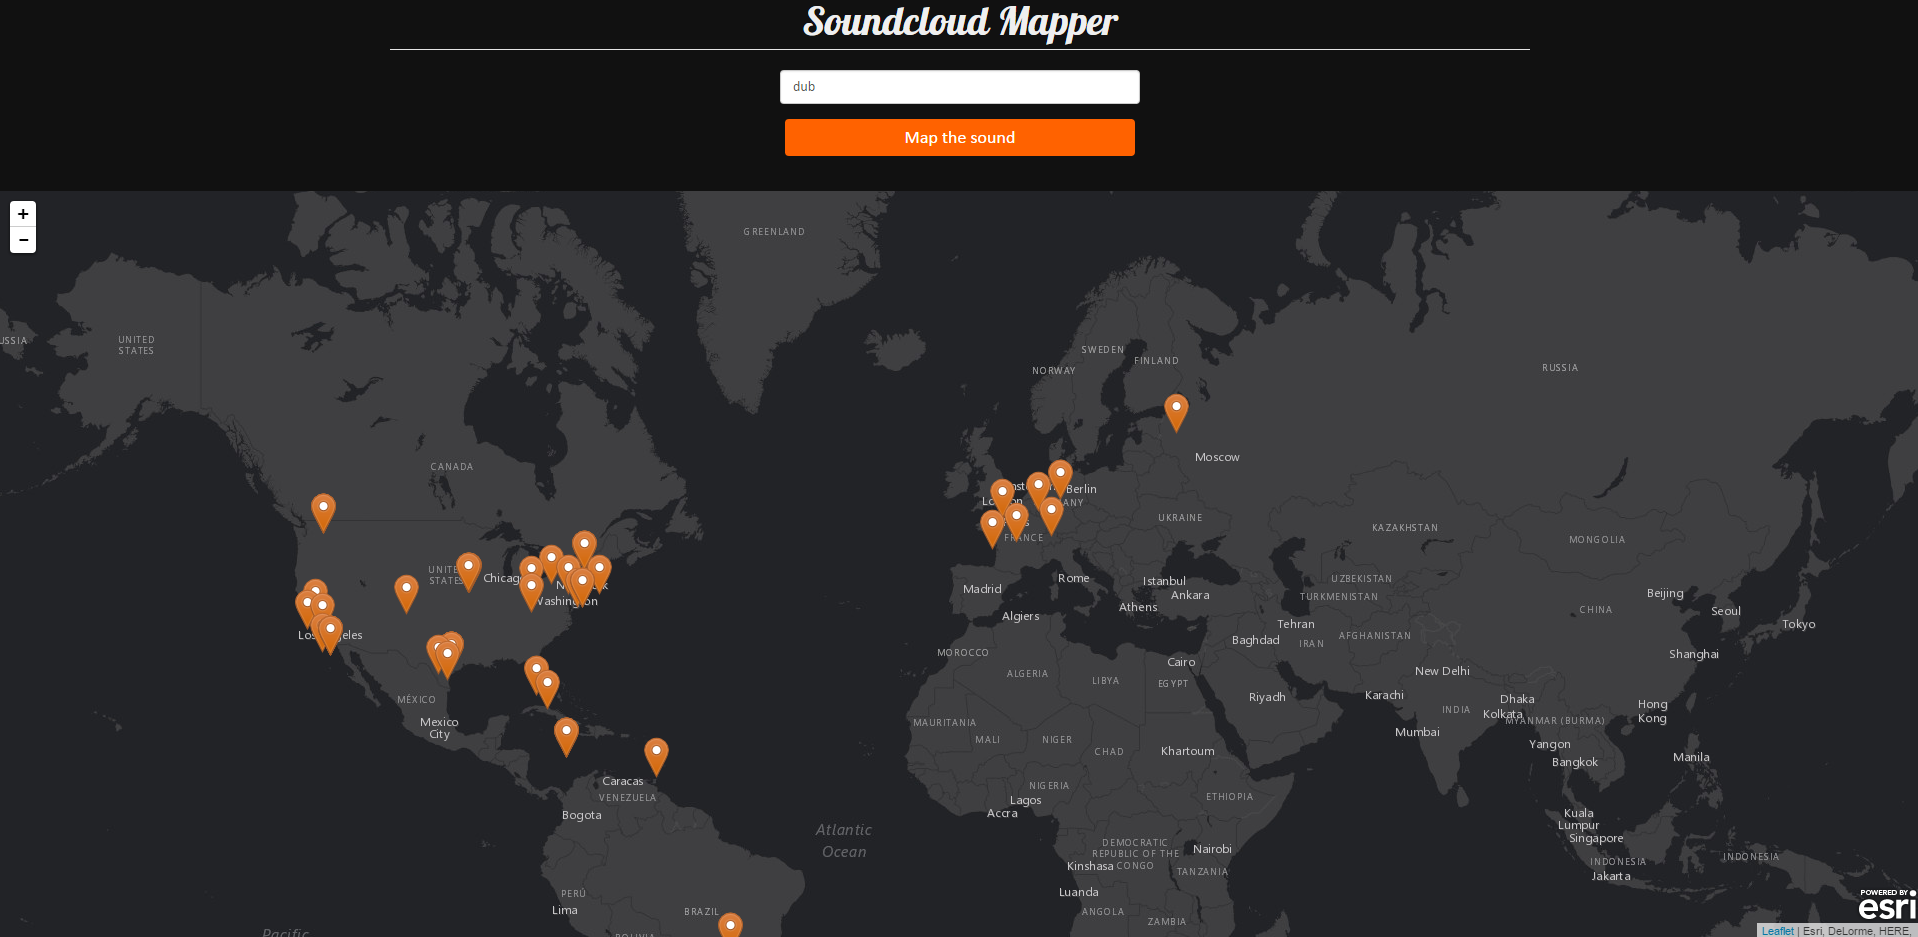
The application allows users to search for a genre of music (i.e. Dance) and then sifts through tracks pulled through the API with this attributed genre and attempts to geocode their location. It does this by looking at the city and country information provided by Soundcloud and passing that into the ArcGIS geocoding service. Once geocoded they are placed onto the map. The Soundcloud tracks API provides information relating to the tracks (artist name etc.) enlisted with that genre and also a nicely embeddable iframe encapsulating a Souncloud music player for that track. The app takes this and puts the music player within the popup when the user selects one of the pins on the map.

The page makes use of the Esri Leaflet API as I wanted to explore making use of this library, especially as this was a slightly more lightweight application. The app also makes use of the spiderify leaflet plugin which helps deal with the issue of overlapping pins at the same location. The plugin allows you to click on a cluster of pins and it spins them out from their original center so you can click them individually. This is useful in this scenario as we only get city level granularity at for track locations.

What did you use?

What does it look like?

Just reminded me, did you map the songs again?

Soundcloud's API does not provide latitude and longitude for their tracks. However the do provide a textual location for the track. Via the ArcGIS geocoding service it was possible to geocode the addresses. Some checking is done to avoid empty strings, "Global", or "Worldwide"

Can I have a play? Where is the code?

The live demo is available here. You can also find the code on GitHub at this url,

more
3 4 3,737
JamesMilner1
Deactivated User

For a long while I've been wanting to make an app that implements both the Twilio and ArcGIS APIs. Thankfully I've had a little more time recently and over the past couple weeks I have been working on On My Way. On My Way is a basic web application that highlights the powers of the ArcGIS Routing REST API and the Twilio SMS API. If you haven't tried it yet, the routing API allows you to route between two given locations as a service. It has a host of parameters to try out including method of transport (Walking, Driving, Trucking), directions and barriers (places you don't want to route through). The Twilio SMS API provides developers a simple interface for the sending of texts (SMSs) to numbers of their choosing, and also has a selection of helper libraries in various languages.. You can check out Twilio' s website​ for more information on their services.

OK cool, what does it do?

A basic outline of the functionality of 'On My Way' is as follows:

  1. User A inputs a friends Postcode (ZIP Number?!)  and friends mobile number. The user then selects if they are driving or walking.
  2. User A is then presented with a screen informing them there friend has been texted with their mode of transport and how long it will take them. They are also given a map demonstrating the suggested route
  3. User B is delivered a text with this information.

How was it Implemented?

Front End

The front end made use of some of some really nice input effects (built by Codrops; see here for GitHub repo and here for the article). I went with the 'Yoko' style which gives this cool 'popup'-like user input with the label text underneath. The app also made use of some Google Fonts; Pacifico font for the title and Raleway for the input labels / main text. The background image was a open image from unsplash.com

Once User A has submitted the details (User Bs phone number and Postcode) they receive a map with the suggested route to User B on. The map takes the route JSON passed back from the REST request made in the PHP script via AJAX.

Back End

The back end used PHP (Boo, hiss), making ArcGIS REST requests using cURL and outputting the results to both an SMS via Twilio and back to the client using AJAX. The Twilio SMS API was very easily implemented using their PHP SKD. ​I imagine it would be a similar task to implement the functionality in other languages such as Python or Ruby.

Can I have a play?

.

I've open source the project and left it on my GItHub account for everyone to have a tinker with if they so wish. You can find the link here. You can also see a live demo here.

more
0 1 2,026
251 Subscribers