ArcGIS JavaScript Maps SDK Blog - Page 9

cancel
Showing results for 
Show  only  | Search instead for 
Did you mean: 

Latest Activity

(85 Posts)
JamesMilner1
Deactivated User

KML or Keyhole Markup Language is an XML data structure for storing geographic information. The format was made popular by Google when they acquired Keyhole in 2004 and used it as their de facto file type for geographic data storage for use with their mapping products. It is now a OGC standard.

What does KML look like?

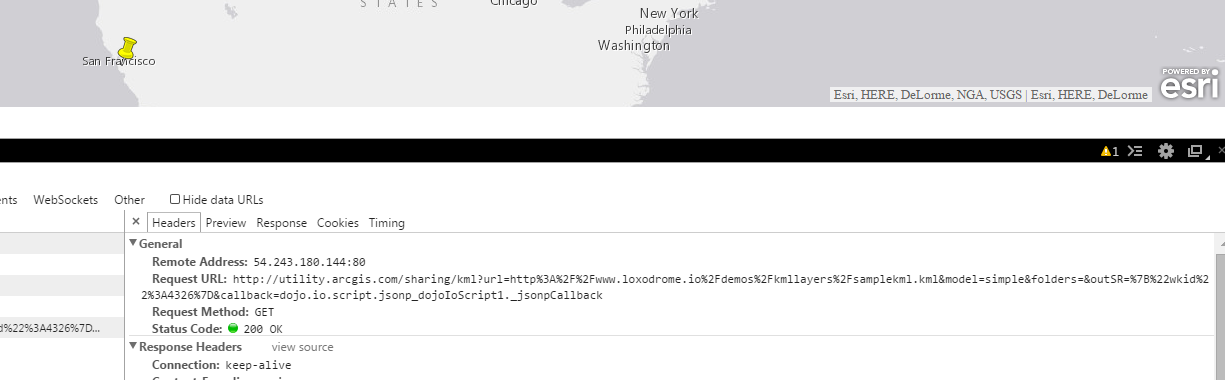
Below we can examine a snippet of KML (thanks Wikipedia!). At the first line it is possible to see how the markup starts with standard XML tags. The second line defines the markup as being KML. On line 4  we then define a 'Placemark' with child nodes defining things like the place name and description. Google use Placemarks as very simple markers for positioning a data point on a map. The default symbology is a yellow pin. If we jump to line 7, we can it is possible to see where we explicitly state that this is a Point geometry with the coordinates coming as a child node (line 😎 of this.

<?xml version="1.0" encoding="UTF-8"?>
<kml xmlns="http://www.opengis.net/kml/2.2">
<Document>
<Placemark>
  <name>New York City</name>
  <description>New York City</description>
  <Point>
   <coordinates>-74.006393,40.714172,0</coordinates>
  </Point>
</Placemark>
</Document>
</kml>

How can we use KML in our ArcGIS JavaScript app?

The ArcGIS JavaScript API provides a module for dealing with KML files: KMLLayer. KMLLayer allows us to provide a URL to a public facing KML file and use that geographic data in our ArcGIS JavaScript app. Indeed because of the nature of KML the API actually turns the KML into a series of Feature Layers using a ArcGIS service, so its easier to think of the KMLLayer as a group of layers as opposed to one homogeneous layer.

The KMLLayer converts the KML file down into one of three feature layers; one for points, one for lines and one for polygons. For most intents and purposes you can use a KML layer like you would any other Feature Layer. For example you can query them and use them in geoprocessing tasks.

It is important to note that we must use explicit absolute path names to our KML file to for the KMLLayer to work! This is because the file path gets sent to a utility service to process the KML into the returned Feature Layers.

A Hello World Example

    
    require([    
    "esri/map",  
    "esri/layers/KMLLayer", 
    "dojo/domReady!"    
    ],          
    function(Map, KMLLayer, PictureMarkerSymbol, SimpleRenderer) {  

        var map = new Map("map", {    
           basemap: "gray",    
           center: [0, 30], // longitude, latitude    
           zoom: 4  
         });  

        // A KML Layer: We must explicitly state the full URL (relative URLs will throw errors!)
        var layer = new KMLLayer("http://www.loxodrome.io/demos/kmllayers/samplekml.kml", {  });
        layer.on("load", function() {
            var layers = layer.getLayers()
            console.log(layers);
        });

        map.addLayer(layer); // Add the layer to the map  

    });

Here we create a KMLLayer (line 16) and then wait for it to return the relative Feature Layers from the utility service. We then use the .on method for wait for it to have loaded and console log it's layers (line 18). This demonstrates how we can quite simply take a KML url and have a layer on the map in a few lines of code. The KMLLayer will also maintain symbology and attributes.

How can I use firewalled KML files?

You will need to use your own utility service which requires Portal for ArcGIS. After this you can configure your JavaScript to use the service:

require(["esri/config"], function(esriConfig) {
  esriConfig.defaults.kmlService = "http://servername.domain.suffix/arcgis/sharing/kml";
});

KML Samples:

more
1 1 3,043
JamesMilner1
Deactivated User

Following on from my previous post examining GraphicsLayers and FeatureLayers, I now want to look at CSVLayers (We'll look at KMLLayers next time!).

CSVLayers

CSVLayers allow you to add CSV data to a map. When we create a new layer, the module will work out the geographic attributes in the csv table provided and use these to place the point data to the map (see below the code for allowed geographic field names). Lets imagine we have a csv file with Boris Bike stations (a cycle share scheme) in London, alongside how many available docks there currently are at the station. One of the fields is titled 'long' and another is 'lat'. We can simply create a new layer by creating a new CSVLayer object and passing the first argument as a string with the location of the CSV file (line 18 in code below). In this example for simplicity the file is stored on the same web host in a folder called 'csv'.

We must then pass a object with two key value pairs to express explicitly which field data we wish to pull through from the CSV file. First key value pair consists of the key 'name' and the value which is "INSERT_FIELD_NAME". The second key value pair is the key 'type' and then a string expressing the type of the field. Allowed types are "Date", "Number" and "String".

Lets take a look at a working example as it will make a lot more sense! Take a look at line 19 for a working example of how to setup the fields we wish to pull through with the appropriate type.

           require([  
            "esri/map",
            "esri/layers/CSVLayer",
            "esri/symbols/PictureMarkerSymbol",
            "esri/renderers/SimpleRenderer",
            "dojo/domReady!"  
            ],        
            function(Map, CSVLayer, PictureMarkerSymbol, SimpleRenderer) {


                var map = new Map("map", {  
                   basemap: "gray",  
                   center: [-0.122, 51.514], // longitude, latitude  
                   zoom: 13 
                 });

                // CSV Layer created using the fields we want to bring through to the client
                var layer = new CSVLayer("csv/borisbikes.csv", {
                  fields: [{name: "name", type: "String"}, {name: "empty_docks", type: "Number"}]
                });
                
                var logo = new PictureMarkerSymbol("imgs/logo.png", 16, 11); // Define a marker image 
                var simpleRenderer = new SimpleRenderer(logo); // Define a new renderer
                layer.setRenderer(simpleRenderer); //Set the simple point renderer to the feature layer
                
                map.addLayer(layer); // Add the layer to the map


            });

I've tested some longitude and latitude field titles and the following have worked for me:

  •      long, lat
  •      lon, lat
  •      longitude, latitude
  •      Longitude,  Latitude
  •      LONGITUDE, LATITUDE
  •      x, y
  •      X, Y
  •      Mixtures of these appear to work, although I would avoid it for sanity reasons!

It is important to note the key differences between the CSVLayer and  the FeatureLayer, which are expressed in the documentation.

  • "edits are applied on the client not posted to the server."
  • "The feature layer generates a unique object id for new features."
  • "[CSVLayer] Does not support queries that need to be performed on the server, e.g. queries with a where clause or non-extent based spatial queries."
  • "The feature layer toJson method returns an object with the same properties as the feature collection. The returned object includes all the features that are in the layer when the method is called. This method can be used to access a serializable representation of the features that can be saved on the server."

With regards to crossdomain issues, if you are using a CSV file that is not from the same domain as the hosting website, you require a server with CORS enabled or a proxy.

more
0 0 2,730
JamesMilner1
Deactivated User

Introducing Layers - Part 1

Layers are data sets (generally of the same theme) that can be added to your map; for example you might have a data layer expressing local police stations, or cafes. Your web map might have multiple layers and in ArcGIS JavaScript API you can mix am match you layers. Think of the map as your canvas and your layers as your paint. There are several different types of layers available to you, but in this blog post I will cover two of the most used and fundamental layer types; the Graphics Layer and the Feature Layer.

Graphics Layers

Graphics Layers allow you to add arbitrary markers (graphics) to your map. A graphic layer might contain markers with the location of benches, bins, or trees in your local area for example. When you initiate a map using the ArcGIS JavaScript API, it comes with a graphics layer initially (map.graphics) however you can add more layers where necessary.

GraphicsLayers can add graphics, which are constructed using a geometry, a symbol, attributes, and/or an infoTemplate (an infoTemplate is a template for the popup that appears when you click on a graphic on the map).

Attributes are just a JavaScript object, with named value pairs i.e. { key1: value1, key2: value2 }. You can assign attributes by using the graphic.attributes property, and assigning a JavaScript object.

Geometries can be constructed coordinates from arbitrary data sources, such as databases or iterated data API returns, just make sure that you know which coordinate system is being used with such data.

You can also create a graphic using a json object. Visibility can be turned on an off using the visibility property (Boolean).

We can use Multipoint  Point  Polygon  Polyline geometries with specific types of symbols:

Text symbols require point geometries to add to the map, although a good example to get a point geometry from an arbitrary polygon can be seen here.

Here is an example of setting the a graphics layer with a SimpleMarkerSymbol, a custom geometry point and infoTemplate:

var map;

require([
     "esri/map",  
     "esri/graphic", 
     "esri/geometry/Point",
     "esri/symbols/SimpleMarkerSymbol", 
     "esri/InfoTemplate", 
     "dojo/domReady!"
     ], 
     function(Map, Graphic, Point, SimpleMarkerSymbol, InfoTemplate) {
       
         map = new Map("map", {
          basemap: "streets",
          center: [-1.268388,51.753249], // longitude, latitude
          zoom: 17
         });

         var locationLayer = new esri.layers.GraphicsLayer();
         var point = new Point(-1.268388,51.753249);
         var symbol = new SimpleMarkerSymbol().setColor("#1036DE").setSize(20);
         var graphic = new Graphic(point, symbol);
         locationLayer.add(graphic);
                           
         var infoTemplate = new InfoTemplate();
         infoTemplate.setTitle("<b>Saïd Business School</b>");
         infoTemplate.setContent("Park End St, Oxford, OX1 1HP <br> <b>Coordinates:</b> 51.753249,  -1.268388");
         graphic.setInfoTemplate(infoTemplate);
         map.addLayer(locationLayer)  // Makes sure that map is loaded
                                                        
});

Feature Layer

The FeatureLayer is similar to the GraphicsLayer (it inherits it) however it allows the user to make use of a Feature Service to provide its geometry data, attributes and symbology. You can create feature services from your developer account, (Hosted Data -> Create Feature Service) and also from CSV files‌ or uploading a Shapefile, or GeoJSON. You can GUI edit Feature Services through the ArcGIS Online interface. When the feature layer is added to the map, symbols and attribute data are pulled through for the current view extent.

The feature service has four modes that can be used in its constructor:

  • MODE_AUTO: “If the total number of features in a layer are less than maxRecordCount and total vertexes is less than 250,000, snapshot mode is used. Otherwise, on-demand mode is used.
  • MODE_ONDEMAND: “In on-demand mode, the feature layer retrieves features from the server when needed.
  • MODE_SELECTION: “In selection mode, features are retrieved from the server only when they are selected.
  • MODE_SNAPSHOT: “In snapshot mode, the feature layer retrieves all the features from the associated layer resource and displays them as graphics on the client.”

Default mode is MODE_ONDEMAND. We can also use attributes from the feature service in the infoTemplate (the popup on click) using string substitution:

Here is an example of using a hosted Feature Service on a map using MODE_ONDEMAND:

var map;  
require([  
"esri/map",   
"esri/graphic",   
"esri/geometry/Point",   
"esri/symbols/SimpleMarkerSymbol",   
"esri/InfoTemplate", 
"esri/layers/FeatureLayer",
"dojo/domReady!"  
],        
function(Map, Graphic, Point, SimpleMarkerSymbol, InfoTemplate, FeatureLayer) {  
     map = new Map("map", {  
       basemap: "streets",  
       center: [-98.2926121, 38.49233], // longitude, latitude  
       zoom: 8  
     });  
    
     var infoTemplate = new InfoTemplate("${FIELD_NAME}", "Oil and Gas Field");  
     var featureLayer = new FeatureLayer(  
     "http://sampleserver1.arcgisonline.com/ArcGIS/rest/services/Petroleum/KGS_OilGasFields_Kansas/MapServ...",{  
          mode: FeatureLayer.MODE_ONDEMAND,  
          infoTemplate: infoTemplate,  
          outFields: ["*"]   
     }); 
  
     map.addLayer(featureLayer);  
  
 });
  1. });

To get arbitrary data from the feature layer you must do a query. The query method is fairly extensive, but one of its most important features is the ability to use query.where which allows for SQL like querying.

//initialize & execute query
var queryTask = new esri.tasks.QueryTask(
"http://sampleserver1.arcgisonline.com/ArcGIS/rest/services/Specialty/ESRI_StatesCitiesRivers_USA/Map..."
);

var query = new esri.tasks.Query();
query.where = "STATE_NAME = 'Washington'";
query.outSpatialReference = {wkid:102100};
query.returnGeometry = true;
query.outFields = ["CITY_NAME"];
queryTask.execute(query, addPointsToMap);

//add points to map and set their symbology + info template
function addPointsToMap(featureSet) { 
    dojo.forEach(featureSet.features,function(feature){     
         map.graphics.add(feature.setSymbol(defaultSymbol).setInfoTemplate(resultTemplate));
    });
}

Next in the series I aim to examine CSVLayers, KMLLayers and potentially MapImageLayers.

more
2 3 4,402
JamesMilner1
Deactivated User

When using the ArcGIS JavaScript and REST APIs for building an app to target public users (as opposed to ArcGIS named users), it is common to want to use credit consuming services such as routing, geoenrichment, batch geocoding. In order to do this you must authenticate your application with the target service. The recommended way of doing this is through OAuth2 and application credentials.

<script>

      var map;

      require(["esri/map", "dojo/domReady!"], function(Map) {
            map = new Map("map", {
                  basemap: "topo",
                  center: [-122.45, 37.75], // longitude, latitude
                  maxZoom: 4, // Minimum zoom level
                  minZoom: 15, // Maximum zoom level
                  sliderStyle: "small", // Small slider, other option is large
                  zoom: 13 // Zoom level
            });
      });
     
      // Setup the proxy rule
      urlUtils.addProxyRule({
            proxyUrl: "/proxy/proxy.ashx",
            urlPrefix: "route.arcgis.com"
      }); 


</script>

Here you can see a standard ArcGIS JavaScript API ‘Hello World’ map. However we set it up to use the urlUtils to redirect through a proxy to attach our credentials for authentication. The location of the proxy can be seen in the proxyURL value (line 18). The service we want to use it for can be seen in the urlPrefix ‌(line 19).

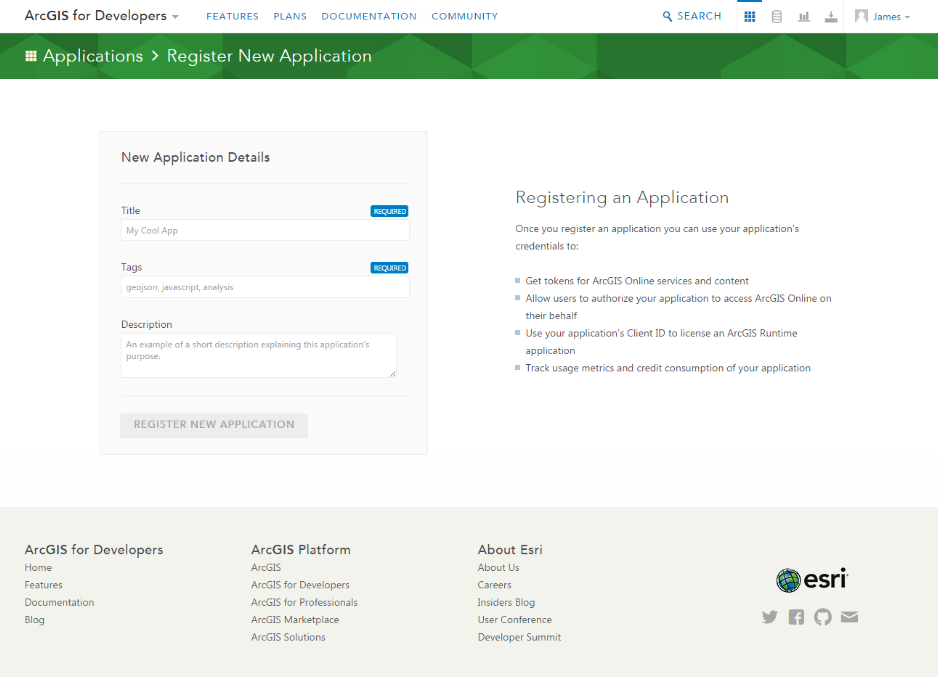
In order to authenticate our request for credit consuming services (routing, geoenrichment, etc) we need to register for a developer account, and register a new application. You can register for a developer account at http://developers.arcgis.com .

Once you have registered your free developer account, you can create a set of application credentials from your control panel, by clicking the applications tab.

devsignin.png

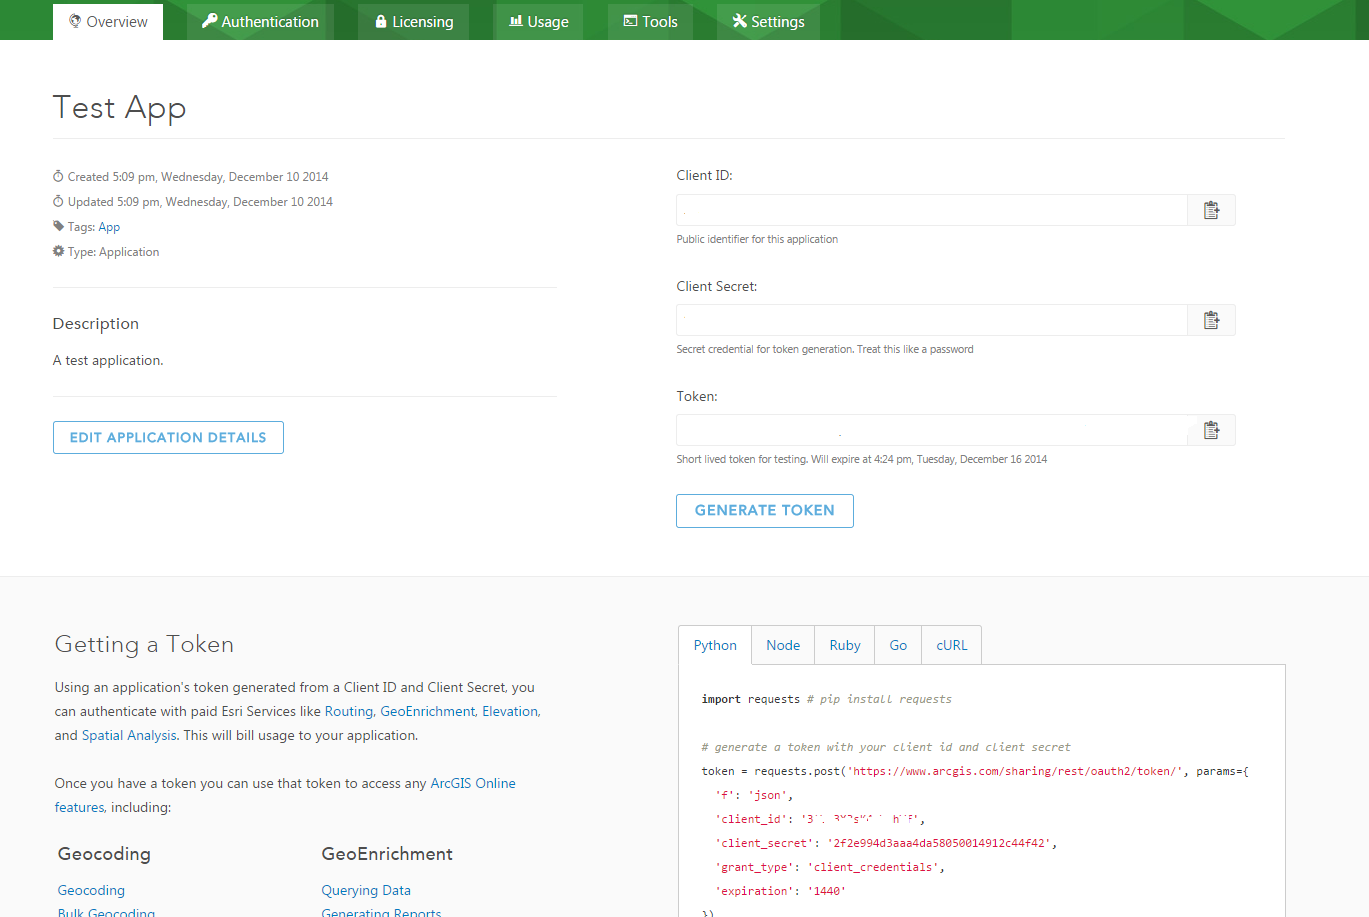
When you do this you will receive a Client ID and a Client Secret (also a Token however this will expire). We can also get some nicely auto generated code for server side REST requests using Python, Node.js, Ruby, Go, cURL. You may also be interested in the ‘Usage’ tab that gives you a dashboard about credit usage.

devappspage.png

As the JavaScript API wraps around the REST API, we could potentially go about appending credentials to REST API calls (via AJAX) in your JavaScript. However this is considered bad practice and a security vulnerability as someone could easily steal these by looking at your plain text JavaScript which is downloaded by the client.

Instead it’s best to append them to the requests server side, through a proxy. A proxy runs on your web server and allows you to have you traffic come through the file proxy. The proxy can append the Client ID and Client Secret to the URL and thus saves you putting the application credentials in your client side code.

Esri maintains three file proxies for you to use, with fitting documentation for their usage. The file proxies are available in PHP, .Net and Java, all hosted for download on GitHub under an Apache License.

As an example let’s imagine you are a web developer running IIS on as your localhost web server. You can simply put the proxy in your route file folder (normally something like C:\inetpub\wwwroot) and update the proxy to deal with REST requests made from the JavaScript API.

The only file we are directly interested is the proxy.config. The config is an XML file that we can update to choose specific URLs to apply our credentials too. For example (fill in your own clientId and clientSecret):

<serverUrl url="//geoenrich.arcgis.com"
                  clientId="XXXXXXXXX"
                  clientSecret="XXXXXXXXXXXXXXXXXXXXXXXXX"
                  rateLimit="600"
                  rateLimitPeriod="60"
                  matchAll="true">

Notice how we use a http agnostic // instead of https: or http:. There are a couple parameters we can change including rate limiting (limiting the number of requests, to prevent overusage). And also “matchAll” which “when true all requests that begin with the specified URL are forwarded. Otherwise, the URL requested must match exactly”.

From here we can use the proxy in our JavaScript code via the urlUtils module and this code snippet


urlUtils.addProxyRule({
                  proxyUrl: "/proxy/proxy.ashx",
                  urlPrefix: "http://route.arcgis.com"
            })

You can also change your config to always use a proxy for ArcGIS REST endpoints using:

     esriConfig.defaults.io.proxyUrl = "/proxy/proxy.ashx";
     esriConfig.defaults.io.alwaysUseProxy = true;

Now that we have configured the proxy we can begin to start using credit consuming services in our JavaScript application. In my next post I will explain how we can use routing services using our application credentials.

more
1 1 3,483
KellyHutchins
Esri Notable Contributor

Jerome Yang of the JavaScript team has written some great blog posts on data visualization with the ArcGIS API for JavaScript.  Post one in the series is an introduction to the topic. Post two covers unique value renderers and Post 3 discusses adding support for popups and legends.

more
1 2 3,504
251 Subscribers