Turn on suggestions
Auto-suggest helps you quickly narrow down your search results by suggesting possible matches as you type.
Cancel
GIS Life Blog - Page 8
Turn on suggestions
Auto-suggest helps you quickly narrow down your search results by suggesting possible matches as you type.
- Home
- :
- All Communities
- :
- ArcGIS Topics
- :
- GIS Life
- :
- GIS Life Blog
- :
- GIS Life Blog - Page 8
Options
- Mark all as New
- Mark all as Read
- Float this item to the top
- Subscribe to This Board
- Bookmark
- Subscribe to RSS Feed
Subscribe to This Board
Latest Activity
(463 Posts)
Esri Frequent Contributor
08-25-2019
10:41 PM

2
0
1,446
by
Anonymous User
Not applicable
08-23-2019
06:42 AM
1
0
1,091
by
Anonymous User
Not applicable
08-16-2019
02:16 PM
2
0
817
by
Anonymous User
Not applicable
08-09-2019
11:32 AM
11
3
2,697
MVP Alum
07-24-2019
11:04 AM
2
0
1,944


MVP Alum
07-21-2019
08:12 AM

0
0
261
Esri Frequent Contributor
07-19-2019
04:44 PM

0
0
614
110 Subscribers
Labels
Popular Articles
Explain Georeferencing To Me as If I Were a Five-Year-Old
AdrianWelsh
MVP Honored Contributor
77 Kudos
49 Comments
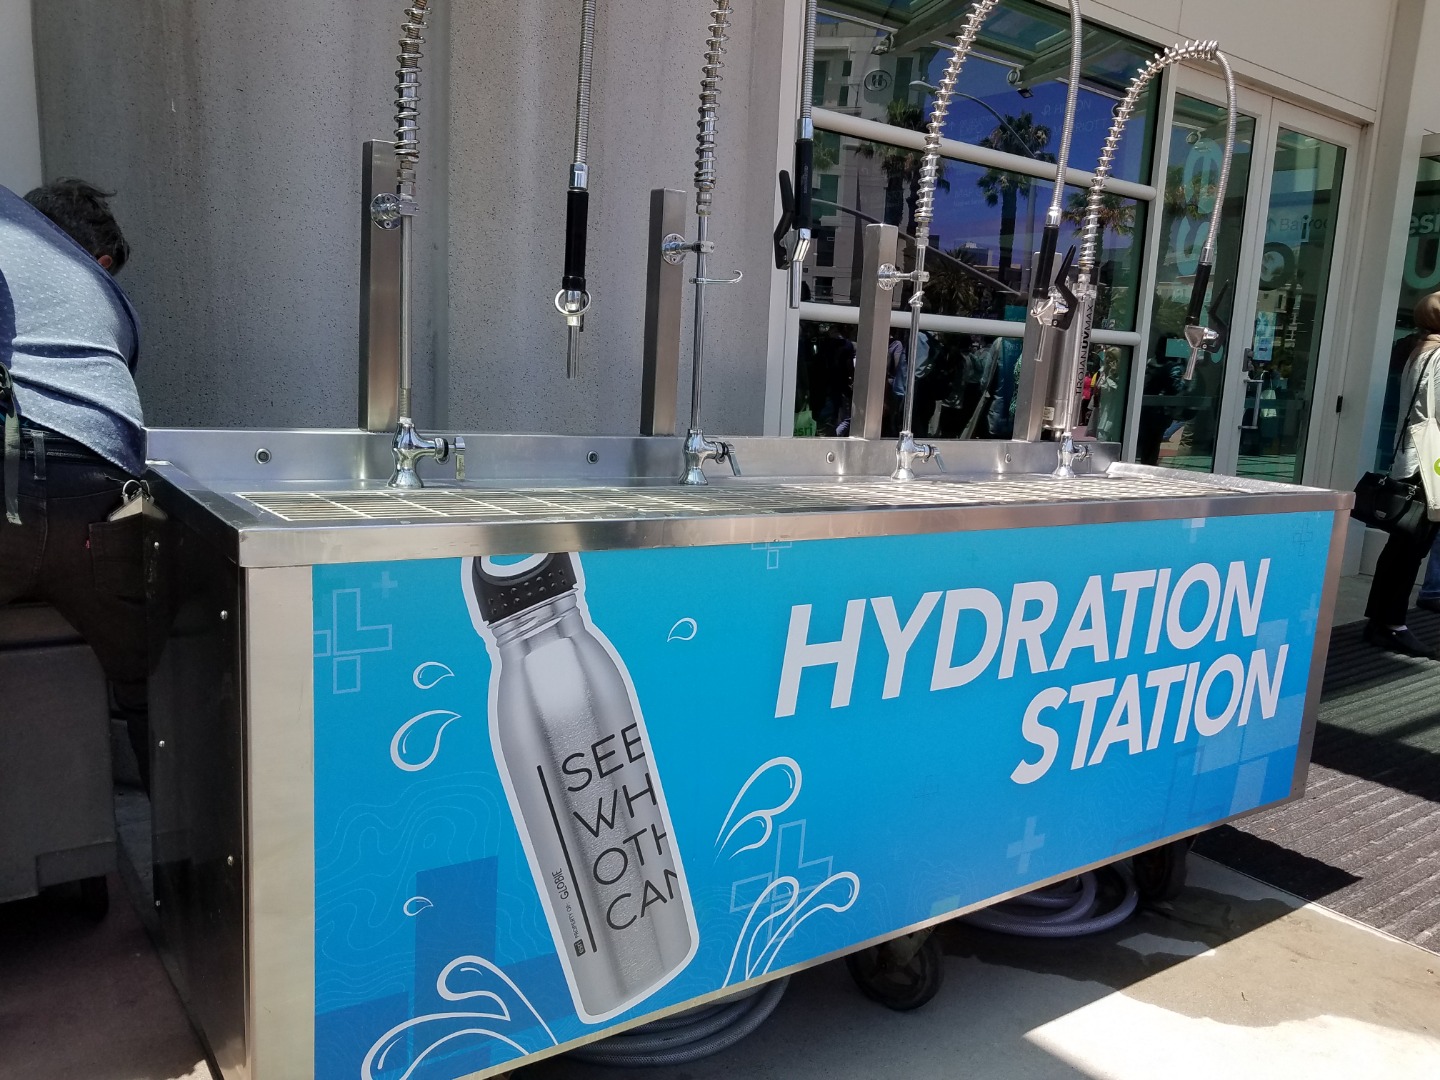
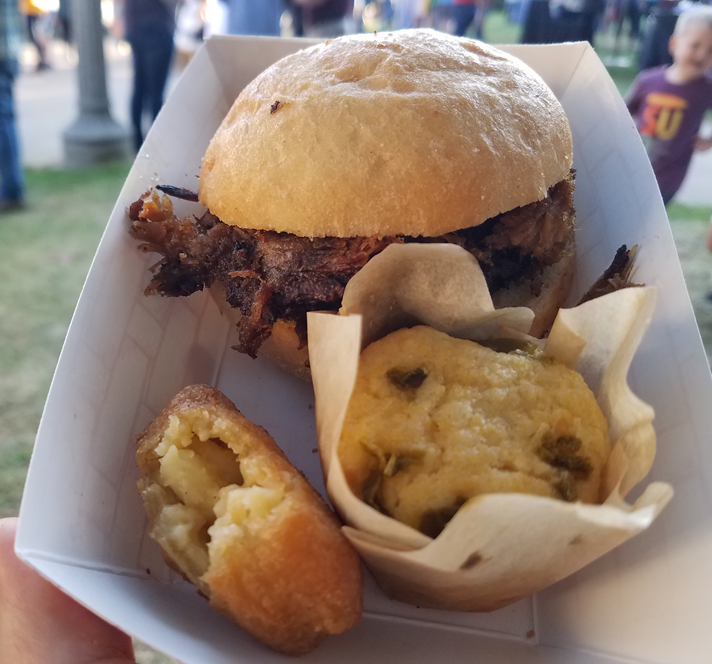
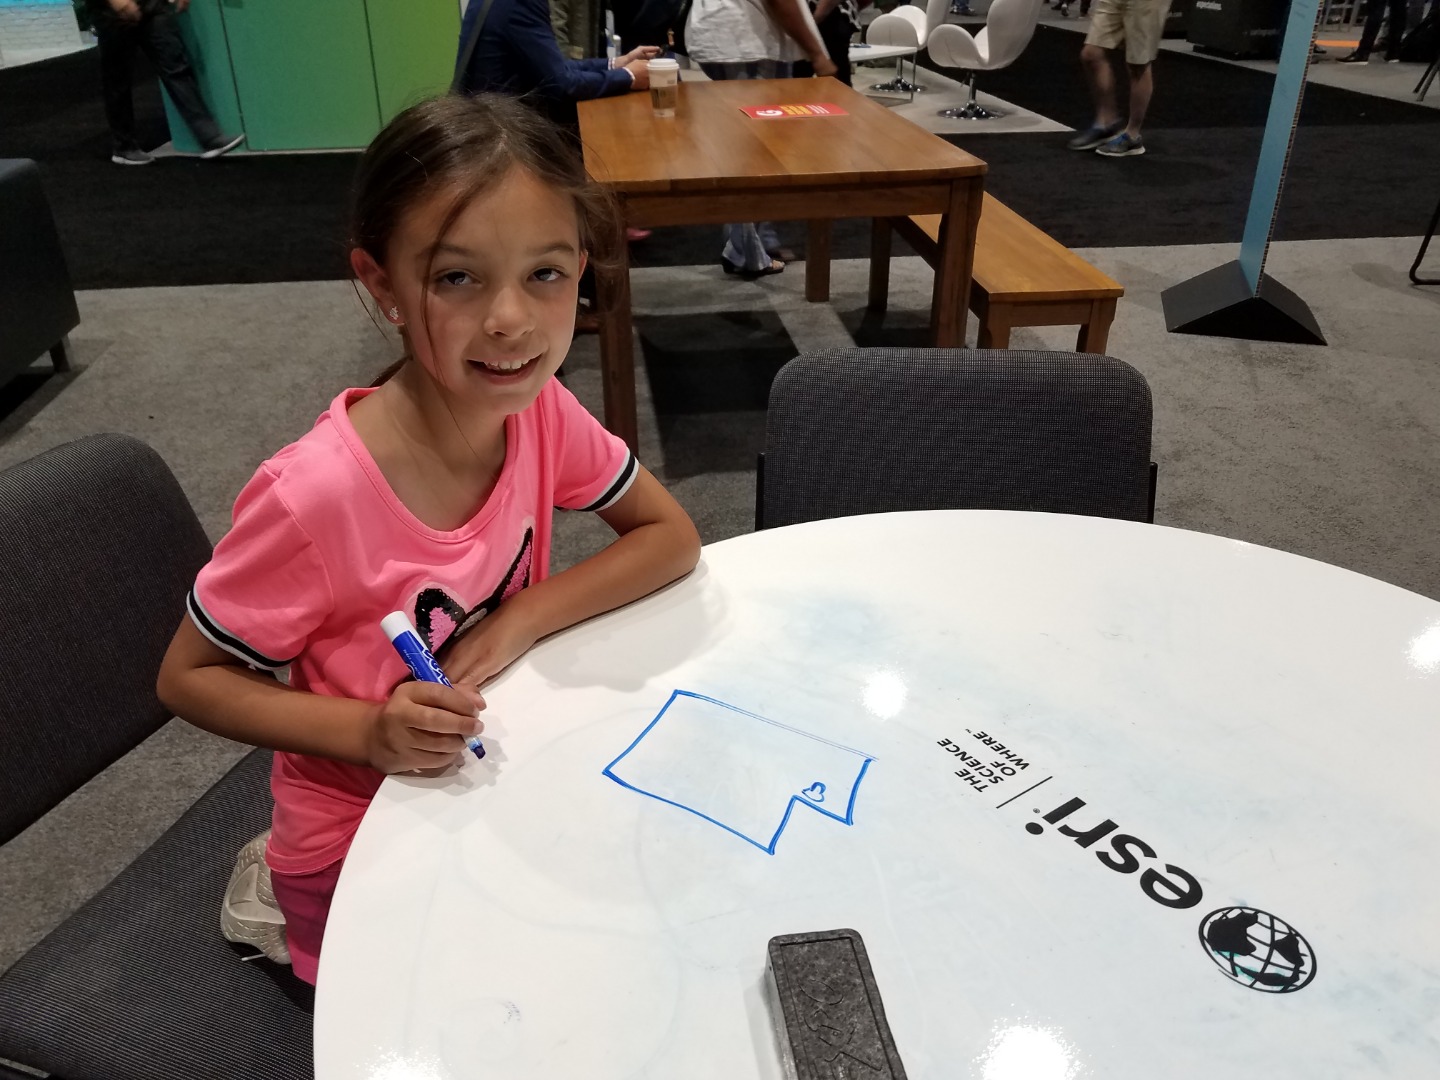
Top Ten Things a Five-Year-Old Would Do at the Esri User Conference
AdrianWelsh
MVP Honored Contributor
21 Kudos
1 Comments
Adrian's thoughts on the 2019 Esri UC
AdrianWelsh
MVP Honored Contributor
17 Kudos
21 Comments