- Home
- :
- All Communities
- :
- Industries
- :
- Education
- :
- Education Blog
- :
- Examining Field Collected Data in ArcGIS Online
Examining Field Collected Data in ArcGIS Online
- Subscribe to RSS Feed
- Mark as New
- Mark as Read
- Bookmark
- Subscribe
- Printer Friendly Page
Examine data that has been generated in the field via a smartphone app. Let’s examine a map in ArcGIS that was created from data generated in the field: http://www.arcgis.com/home/webmap/viewer.html?webmap=51a09dbfed194092bd7d6c6228c2ed40&extent=-116.98...
This map is entitled "Motion X GPS Track: Hike to 34 North 117 West" by jjkerski and will look similar to the map below.

The following steps are the same as those that you can use elsewhere when you use maps in ArcGIS .
Explore the map and data layers. First, click the Contents tab to the left of the map to view the layers. You will note that the map contains 4 layers: Map notes, track points, track lines, and a satellite image basemap. Some layers expand when you click on their names in the Contents tab. The track, for example, expands into points and lines. This is because certain field data collection apps collect several types of spatial data simultaneously; in this case, the app that was used in the field collected point data and line data. Each is useful.
Second, open the table for the point and line layers, as shown below.
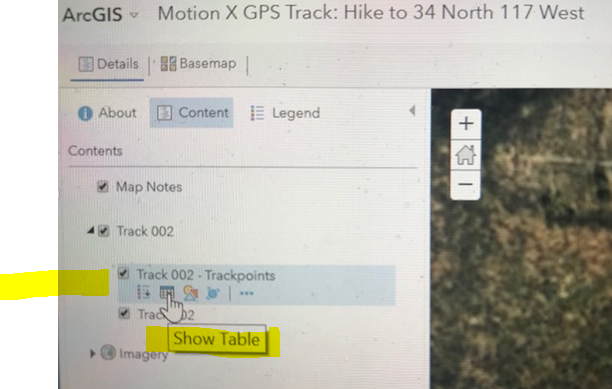
Note that the line layer only contains 1 feature, while the point layer contains 581 features. The fields in the point layer include the elevation (in meters) and the date/time. The point layer is symbolized by elevation, and if you take a quick look at the Legend you will see that the red colors indicate higher elevation and yellows indicate lower elevation.
Third, zoom out a bit to see the entire hike, noting the type of vegetation and terrain traversed, location of the beginning and end of the hike, which sections of the hike followed a trail and which did not, and the high and low points along the hike. Change the basemap to a streets basemap to answer the following question: At the west end of which street did the author park on to begin the hike? Change the basemap back to imagery.
Click on the 2 pushpins to see the photos taken at those locations. These pushpins are “Map Notes” which you have used in this module in the past.
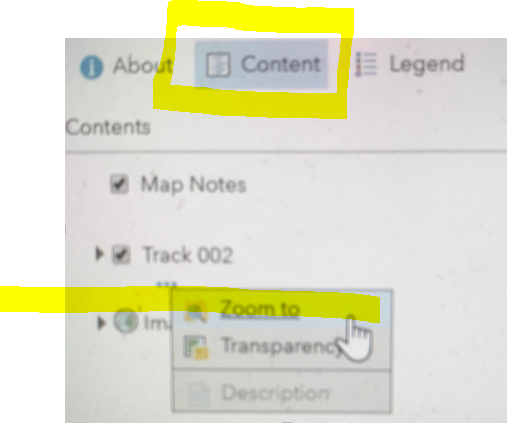
Zoom out further until you can determine the region of the world in which this hike was taken (the chaparral biome of southern California USA). To zoom in to the hike, use the … ellipses for Track 002 > use “Zoom to”, as shown below:
Fourth, use the Measure tool to measure the distance between each of the points that appear along the lines. What is the average distance between each point for a certain section of the hike?
These steps, from one to four above, that include opening the data table, measuring, changing the scale, and accessing the symbology, are standard procedures that you can use on any map and set of layers in ArcGIS .
Examining the app and the types of field data. In this case, the data was collected with a smartphone app, called Motion X GPS. Motion X GPS is one of a series of apps (others include Gaia GPS and Polaris GPS) that collect points and lines in the field. They all emulate a GPS receiver on your smartphone, including displaying locations in a number of different coordinate system, routing, distances, and directions. As you saw on the map, two formats of data are typically collected in the field—point data, and line data. Points can be “track points”, which can be thought of as digital “bread crumbs” that are “dropped” as you move across the landscape at a specified distance or time (such as every 2 meters, or every 1 second). Points can also be “waypoints” that you drop on purpose at locations that you specify—where you measure water quality along a shore, at a tree or light pole, or at a street corner where you are measuring noise. Fitness apps, such as Runkeeper, Strava, and MapMyRun, often output point and line data that can be mapped. One of the common formats for these files is a GPX file, which stands for GPS eXchange Format--a type of XML data file for exchanging GPS data between programs, and for sharing GPS data among many users. So, when examining smartphone field apps for use in education, seek ones that allow for output in a variety of formats, including GPX.
Even though these apps often contain their own mapping interface, what is more useful for educational use is the ability to bring the field collected data into a spatial technology tool such as Google Maps or ArcGIS . If the app itself does not output into an exportable format, sometimes the website for the app includes that capability (such as www.runkeeper.com).
Be critical of the data’s spatial accuracy. In keeping with the theme of being critical of the data, before leaving this data set, zoom to the eastern side of the collected data, near the white circular water tank. Even though the person collecting the data (your module author) walked on the trail in this area going up and going down the ridge, note the offset from the trail for one of the tracks. By examining the date and time stamp on the data, you can determine whether the offset occurred on the way up (climbing from east to west) or the way down (descending from west to east). Measure the offset of this section of the track from the trail as shown on the satellite image, as shown below.
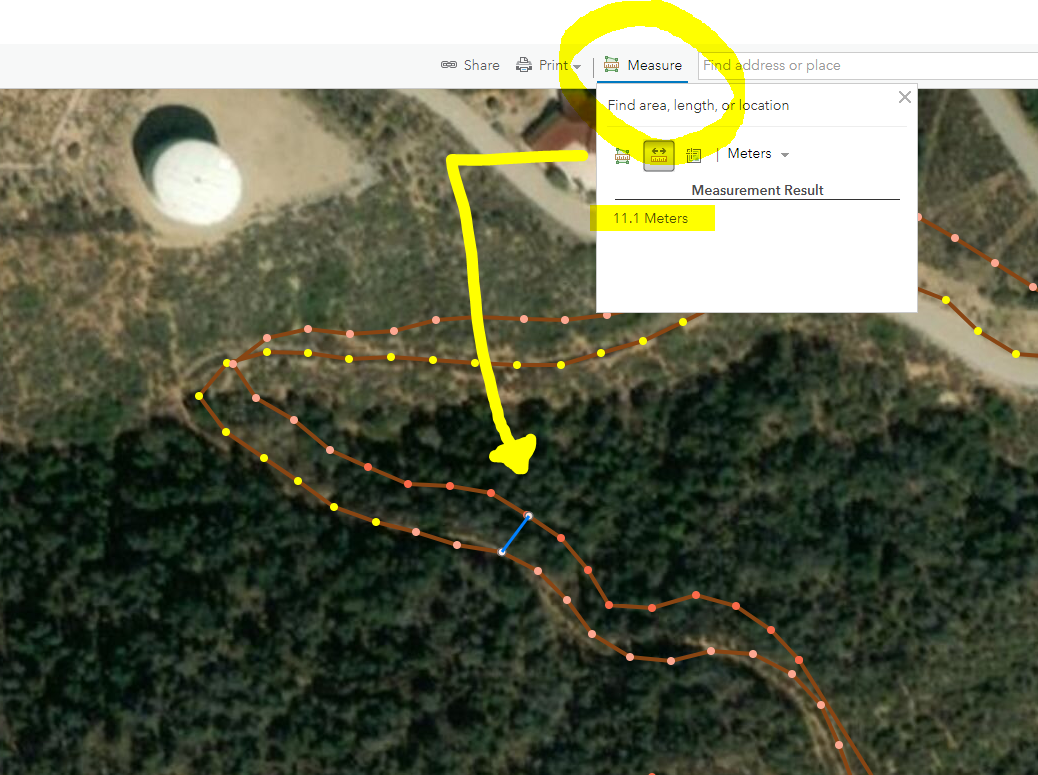
The points could have been compromised in terms of positional accuracy for a number of reasons, including: The field worker could have inadvertently shielded part of the phone with his hand while gingerly picking his way along the trail while collecting the track, the cell phone reception might have fallen off, dense vegetation or the high ridge to the west could have prevented the phone from sensing as many cell phone towers, wi-fi hotspots, and GPS satellites as it had done along the ridgetop, or the app might not have been recording accurately here. This compromising of positions happens when using GPS receivers, as well, and is something you and your students need to continually be examining and questioning. It happens most often near ridges and canyons, such as in the case here, but also in city centres with high rise buildings, and also from within a building or when the field data collector first leaves a building and enters the outdoors. Discuss with students the different accuracy requirements depending on your project. For mapping trees on campus, being a few meters off might not be a problem, but it would be a problem for objects spaced more closely together, such as mapping headstones in a cemetery, or pieces of litter on a city street. Discuss the even finer accuracy requirements for such things as mapping natural gas lines or fiber optic cables.
Be critical of attribute data quality. Thus, spatial data quality is important. The quality of attributes—the information you collect in the field—is also important. Your database will consider “spruce” and “spruse” to be two different types of trees, for example. Some data entry errors can be solved by the use of pull-down menus for field data collection, minimizing the amount of free text entry that has to be done in the field under various conditions. Associated with attribute data quality is ensuring consistent devices and clarity on methods used (for example, to measure the height of a tree). Also associated with attribute data quality is paying close attention to the units you are using in the field. If some students are collecting tree girth in cm and others in mm, that could lead to potential misinterpretation of results. Similar results could occur if one student collected pedestrian counts along a street for 1 minute and another student for 5 minutes.
Now that you have had experience examining field data in an interactive web map, you are ready to investigate other lessons on GeoNet where you will build your own map with the same type of data that was used for the chaparral hike that you examined above.
You must be a registered user to add a comment. If you've already registered, sign in. Otherwise, register and sign in.
-
Administration
90 -
Announcements
88 -
Career & Tech Ed
1 -
Curriculum-Learning Resources
288 -
Education Facilities
24 -
Events
78 -
GeoInquiries
1 -
Higher Education
620 -
Informal Education
286 -
Licensing Best Practices
102 -
National Geographic MapMaker
44 -
Pedagogy and Education Theory
243 -
Schools (K - 12)
282 -
Schools (K-12)
311 -
Spatial data
40 -
STEM
3 -
Students - Higher Education
261 -
Students - K-12 Schools
149 -
Success Stories
45 -
TeacherDesk
1 -
Tech Tips
130
- « Previous
- Next »