- Home
- :
- All Communities
- :
- Industries
- :
- Education
- :
- Education Blog
- :
- Teaching and learning about the Coronavirus (COVID...
Teaching and learning about the Coronavirus (COVID-19) with web maps, dashboards, and infographics
- Subscribe to RSS Feed
- Mark as New
- Mark as Read
- Bookmark
- Subscribe
- Printer Friendly Page
The ArcGIS platform with its data feeds, online tools, and wide array of maps makes it easy and powerful to teach and learn about the spatial and temporal aspects of the grim situation surrounding the Coronavirus (COVID-19).
See the video I created that walks you through these tools. One fast way to engage with these tools is to study the changes over space and time using the popular dashboard set up by Johns Hopkins University. Make sure you also examine the USA county infographics on the same site, to teach about scale (in this case, the county-level scale) and also how to interpret an infographic. These infographics were created with Business Analyst Web. The situation is changing rapidly, and you can use this video to visualize the changes in the early months (between January and March 2020).
Another visualization is the COVIDPulse web mapping application, here. The power of this map is that it is simple to understand but shows trends over time and space, at multiple scales.
COVIDPulse web mapping application.
Another map presented in story map tabbed format is this one showing daily US County trends. Another very informative map is the which way are things going map, below and here.
Which way are things going? County level map.
Another way to teach, learn, and understand the situation is to have students create their own maps. In doing so, they learn how to work with different data sets, and gain GIS skills in map creation, symbolization, classification, saving,a and sharing. They also gain critical thinking, problem solving, and communications skills. A logical starting point is with ArcGIS Online (www.arcgis.com). Start a new Map > Modify Map > Add Data > Search for layers in ArcGIS Online > find the Coronavirus COVID-19 cases by CSSE GIS and Data at JHU, and add it to the map. The data will look like this, in the following example, below.
Coronavirus data in ArcGIS Online.
Since this map is now in ArcGIS Online, you can perform many tasks on it: You can open and examine the table, sort on specific attributes such as "cases", filter the data for specific criteria, change the base map, and add data to the map such as ecoregions, population density, airports, and more. You can do all of this without even signing in to ArcGIS Online, and thus it is easily accessible to anyone. But saving gives you additional power. Once you sign into your ArcGIS Online organization, and save the map, you can now run spatial analysis tools on the data, such as Summarize Within, Overlay, and Enrich. These tools give you additional insights as to patterns, relationships, and significant difference. Note that you need to be creator/publisher in your ArcGIS Online organization to run the analysis tools.
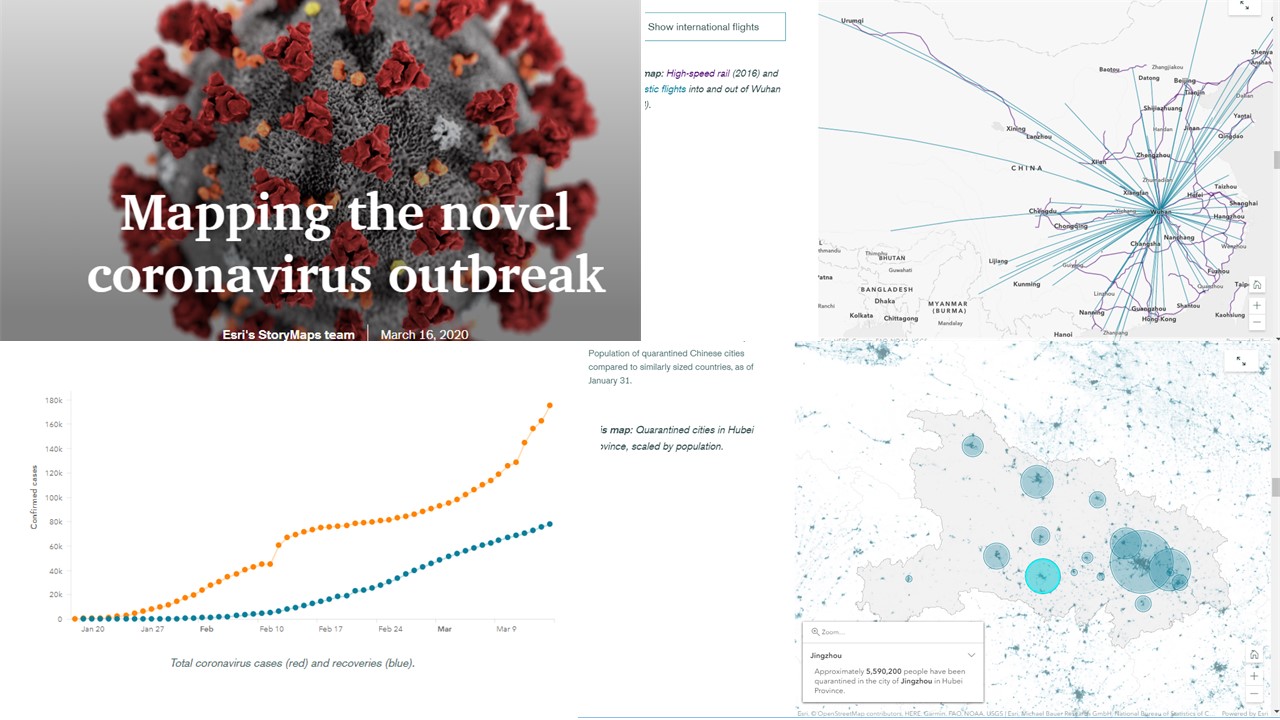
Also, now that you are signed in, you can share the map with others--collaborators, your entire organization's members, or even the whole world. You can also create a multimedia story map from it. This storymap updated daily from the Esri storymaps team, for example, shown in part below, is a powerful teaching tool and could serve as an idea for your own storymap that you or your students could create.

Sections of a Coronavirus Storymap.
You can also bring the layer into a 3D scene, as I did here and as shown below.
3D Scene from the JHU Coronavirus layer.
You can also make a "compare" web mapping application where you, side-by-side, lay out a 2D and a 3D map of the same data.
You can also create your own dashboard from the map, as I did shown here, containing a map, gauges, and graphs, shown below. To learn how to create a dashboard, see my lesson guiding you through surveys, maps, and dashboards.
Dashboard created from ArcGIS Online map.
You can also bring the data into ArcGIS Pro for even further analysis. ArcGIS Pro contains over 1,000 tools for analysis.
New mapping applications are appearing daily, such as this dashboard connected to news articles and shown below.
Coronavirus dashboard with news feed.
Another way of understanding the Coronavirus, and to develop skills in Business Analyst Web, is to create a state-based infographic showing cases, as explained here.
To dig deeper, use the resources in the learning plan Getting Started with ArcGIS Technology for Mapping COVID-19: Fundamentals.
Lastly, the Esri landing Hub site provides additional COVID-19 apps, data, and resources, and is on: https://go.esri.com/coronavirus.
You must be a registered user to add a comment. If you've already registered, sign in. Otherwise, register and sign in.
-
Administration
77 -
Announcements
80 -
Career & Tech Ed
1 -
Curriculum-Learning Resources
257 -
Education Facilities
24 -
Events
72 -
GeoInquiries
1 -
Higher Education
594 -
Informal Education
281 -
Licensing Best Practices
90 -
National Geographic MapMaker
33 -
Pedagogy and Education Theory
224 -
Schools (K - 12)
282 -
Schools (K-12)
272 -
Spatial data
35 -
STEM
3 -
Students - Higher Education
245 -
Students - K-12 Schools
128 -
Success Stories
36 -
TeacherDesk
1 -
Tech Tips
117
- « Previous
- Next »