Turn on suggestions
Auto-suggest helps you quickly narrow down your search results by suggesting possible matches as you type.
Cancel
- Home
- :
- About TimothyHales
TimothyHales
Esri Notable Contributor
since
04-10-2014
01-15-2026
2859
Posts created
965
Kudos given
226
Solutions
2130
Kudos received
Turn on suggestions
Auto-suggest helps you quickly narrow down your search results by suggesting possible matches as you type.
My Ideas
(3 Idea Submissions)Latest Contributions by TimothyHales
|
POST
|
The AirPhotoUSA .map format is not supported natively with ArcGIS. There is mention of a plugin here: MapHandler not working with ArcGIS 9.3 although I haven't seen anything for ArcGIS 10. Supported raster dataset file formats
... View more
05-02-2012
04:41 AM
|
0
|
0
|
477
|
|
POST
|
When calculating joined data, you cannot calculate the joined columns directly. However, you can directly calculate the columns of the origin table. To calculate the joined data, you must first add the joined tables or layers to ArcMap. You can then perform calculations on this data separately. These changes will be reflected in the joined columns. Calculate Field (Data Management)
... View more
05-01-2012
06:04 AM
|
0
|
0
|
2414
|
|
POST
|
Yes, this sounds like some type of Image Classification. It may be Feature Analyst which is an automated feature extraction extension that enables GIS analyst to rapidly and accurately collect vector feature data from high-resolution satellite and aerial imagery. And there is also the ENVI Feature Extraction Module.
... View more
04-25-2012
11:39 AM
|
0
|
0
|
1145
|
|
POST
|
What coordinate system was the data collected in? You will need to select the same coordinate system within the tool. Can you provide a sample of the data?
... View more
04-25-2012
09:39 AM
|
0
|
0
|
1333
|
|
POST
|
It probably has something to do with your table fields having invalid characters. Here is a KB Articles on How To: Format a table in Microsoft Access for use in ArcMap Formatting a table in Microsoft Access for use in ArcGIS
... View more
04-24-2012
07:45 AM
|
0
|
0
|
1531
|
|
POST
|
No, you cannot add more renderers to the symbology tab. The closest thing I was able to get to work is to add the source image to ArcMap and define the symbology. Then under the symbology tab export a colormap. Then apply the new colormap to the mosaic dataset with the functions.
... View more
04-24-2012
06:28 AM
|
0
|
0
|
4043
|
|
POST
|
The only renderers I have is Stretched and Discrete Color. As for 10.1, it is schedulde for release in June 2012. What's new for ArcGIS 10.1
... View more
04-23-2012
12:06 PM
|
0
|
0
|
4043
|
|
POST
|
There is a known issue with changing the symbology renderer to Unique Values for Mosaic Datasets. This has been fixed in 10.1. NIM059496 - Mosaic Datasets does not have an option for unique value renderers available by default under the symbology options for single-band raster data. If you have a colormap (.clr) then you can use the Colormap Function for Mosaic Datasets. Colormap function Editing function chains in a mosaic dataset
... View more
04-23-2012
08:34 AM
|
0
|
0
|
4043
|
|
POST
|
Georeferencing does stretch and rotate the image when adding control points. It sounds like your control points are not very well spaces across your image and are focused in one area. It is best to space them out in each of the corners. Fundamentals for georeferencing a raster dataset: "If possible, you should spread the links over the entire raster dataset rather than concentrating them in one area. Typically, having at least one link near each corner of the raster dataset and a few throughout the interior produces the best results."
... View more
04-23-2012
06:12 AM
|
0
|
0
|
3731
|
|
POST
|
I believe that data loaded into a mosaic dataset is seen as continuous. When you create the mosaic dataset you can change the pixel properties and number of bands. This will ensure that data is loaded correctly. You should still be able to process it just like any other discrete data. The actual stored value will remain discrete.
... View more
04-23-2012
05:19 AM
|
0
|
0
|
4044
|
|
POST
|
Hi Marco, there is a python script that will allow you to do this that you can find here: Generate 3D line from tabular data It will output a 3d polyline from a table using TopX, TopY, TopZ & BotX, BotY, BotZ as the end points.
... View more
04-23-2012
03:32 AM
|
0
|
1
|
7426
|
|
POST
|
You are probably looking for the Create Fishnet tool. This will create a polyline or polygon grid for your input extent. How Create Fishnet works A raster GRID is a dataset format - Supported raster dataset file formats
... View more
04-18-2012
11:06 AM
|
0
|
0
|
823
|
|
POST
|
You can use Spatial Join to determine how many points are within each polygon. The output polygon feature class will have two new fields added (Join_Count and TARGET_FID). Join_Count indicates how many join features match each target feature (TARGET_FID). Then you can select by attribute those that have 3 or more. About joining and relating tables You can also right click the polygon layer in ArcMap > Joins and Relates > Join. Select the option to Join Data From Another Layer Based Upon Spatial Location. Then choose the points layer to join to. The output feature class will contain a count field for each polygon.
... View more
04-18-2012
06:26 AM
|
0
|
0
|
744
|
|
BLOG
|
Downloading Tutorials and Example Data 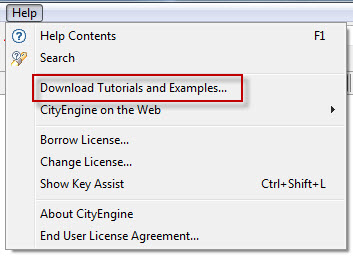 Open the Help menu > Download Tutorials, then download the desired Tutorials and Examples from the Download Tutorials and Examples dialog. Open the Help menu > Download Tutorials, then download the desired Tutorials and Examples from the Download Tutorials and Examples dialog.During the download process, the option to run in the background can be set in the data status window, so that you can continue to work on your scene while the data is loaded. View Settings 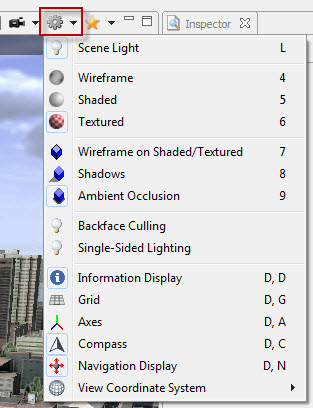 There are a wide range of view settings that can be accessed from the Viewport settings dropdown. To the scene, you can alter lighting settings, activate reference information (grid, axes, compass, etc.). There are a wide range of view settings that can be accessed from the Viewport settings dropdown. To the scene, you can alter lighting settings, activate reference information (grid, axes, compass, etc.).There are also settings for the 3D display, such as wireframe, shaded, textured, or textured display with wireframe. Also, take note of the shortcut keys for toggling these settings. Save Screenshot 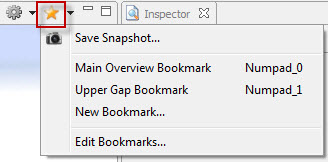 From the bookmarks button in the viewport, you can access the functionality to save a snapshot/screenshot. The output dimensions can be set along with additional information elements. There are a variety of formats available to save the screenshot (.png, .jpg, .tiff, .bmp, etc.). From the bookmarks button in the viewport, you can access the functionality to save a snapshot/screenshot. The output dimensions can be set along with additional information elements. There are a variety of formats available to save the screenshot (.png, .jpg, .tiff, .bmp, etc.).CityEngine Shortcuts 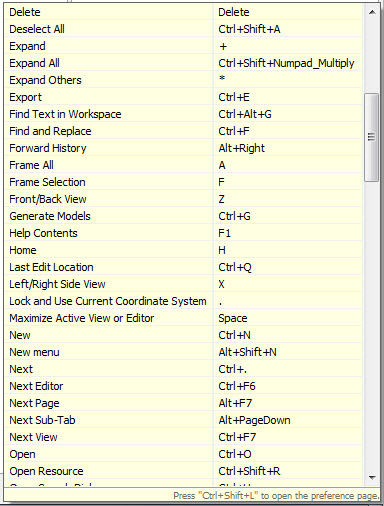 The Key Assist can be accessed from the Help menu or by pressing CTRL + SHIFT + L. This will open a dialog at the bottom right corner with a list of all the shortcut keys. The Key Assist can be accessed from the Help menu or by pressing CTRL + SHIFT + L. This will open a dialog at the bottom right corner with a list of all the shortcut keys.With the Key Assist Window you can press CTRL + SHIFT + L again, to open the Preference dialog, where the default settings can be modified. Window Layout 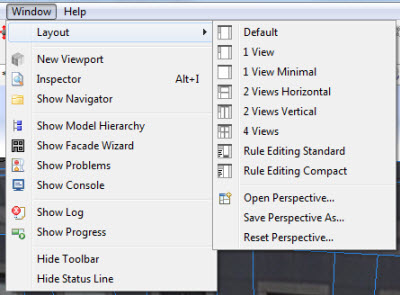 There are many windows available within CityEngine, and you may find yourself looking for a specific one, such as the Viewport or Navigator. The Window Menu will give you access to all windows individually. There are many windows available within CityEngine, and you may find yourself looking for a specific one, such as the Viewport or Navigator. The Window Menu will give you access to all windows individually.Using the spacebar, you can maximize a window to the full screen, docking the other window on the right border. Predefined layouts are available via the Window Menu > Layout. There is also the ability to save a custom perspective if you have a particular setup you like. I hope these tips have helped get you started using CityEngine. If you need additional help, visit the CityEngine section in the Support Knowledge Base or the CityEngine forums. Timothy H. - Raster/3D Support Analyst |