A Location Strategy
Welcome to the 2020 Esri User Conference. First, I would like to introduce the Transit Sales Team. Justin Kruizenga is the Transit Account Executive, and I am Jay Hagen, and I support Justin as a Solution Engineer. We are part of a broader Transportation Team and have the support of Esri Professional and Training Services, among others.
As part of our virtual conference offering, we wanted to provide you with some resources for developing a location strategy at your public transit agency. Location is a major part of transit operations, and ArcGIS provides solutions for meeting location challenges. Some questions you may need to answer include:
- Where are my buses/trains right now? Which ones are running behind schedule? What impacts on-time performance?
- How can I do targeted outreach to customers and potential riders?
- Where are my bus stops? What amenities are at each stop? What is the condition of those amenities?
How do I direct and coordinate my field workforce? Not only bus operators, but maintenance crews? - How can I ensure the agency meets FTA requirements for accessibility, safety, and equitable service?
A fully developed location strategy provides tools and applications to the appropriate user to answer these and other spatially-oriented questions. In this blog post, we will provide information about configurable solution offerings, customer examples, white papers, and information about the System of Engagement, which provides the roadmap for a location strategy.
Solutions
Transit solution offerings are configurations of ArcGIS technology to meet common transit business needs. A solution can also include training and services to stand up the technology in your organization, providing a turn-key solution. Here are some examples of solutions provided by Esri that can be leveraged by a transit agency.
ArcGIS Solutions 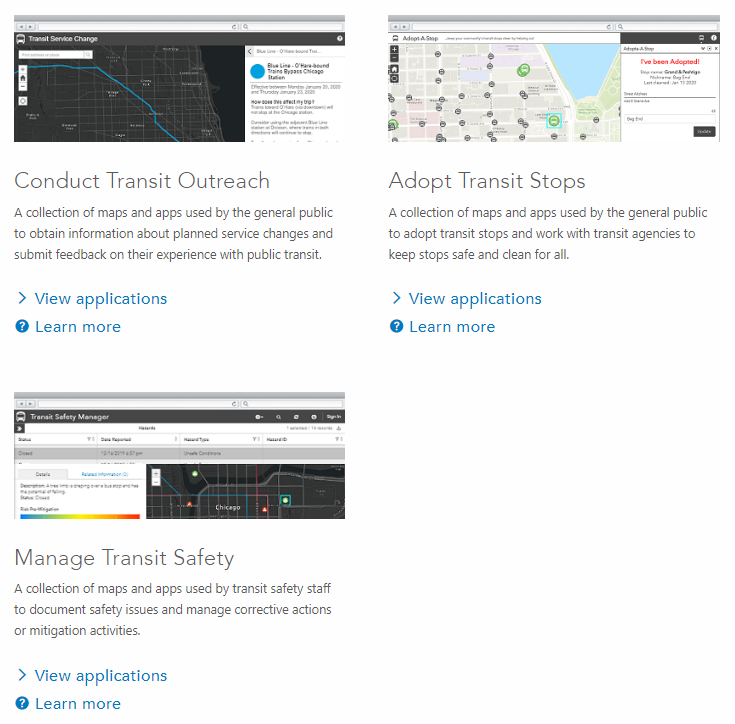
ArcGIS Solutions are provided as free-to-use configurable templates that solve common industry business needs. The Solutions Team at Esri partners with ArcGIS users to identify these needs and build the application configurations. Solution templates for state and local government, emergency management, and utilities have been around for a while now, but we have recently released solutions for transit. Not only are these templates free to ArcGIS users, they are fully supported by Esri technical support and can be quickly deployed with the Solutions Deployment Tool for ArcGIS Pro or the new ArcGIS Solutions App.
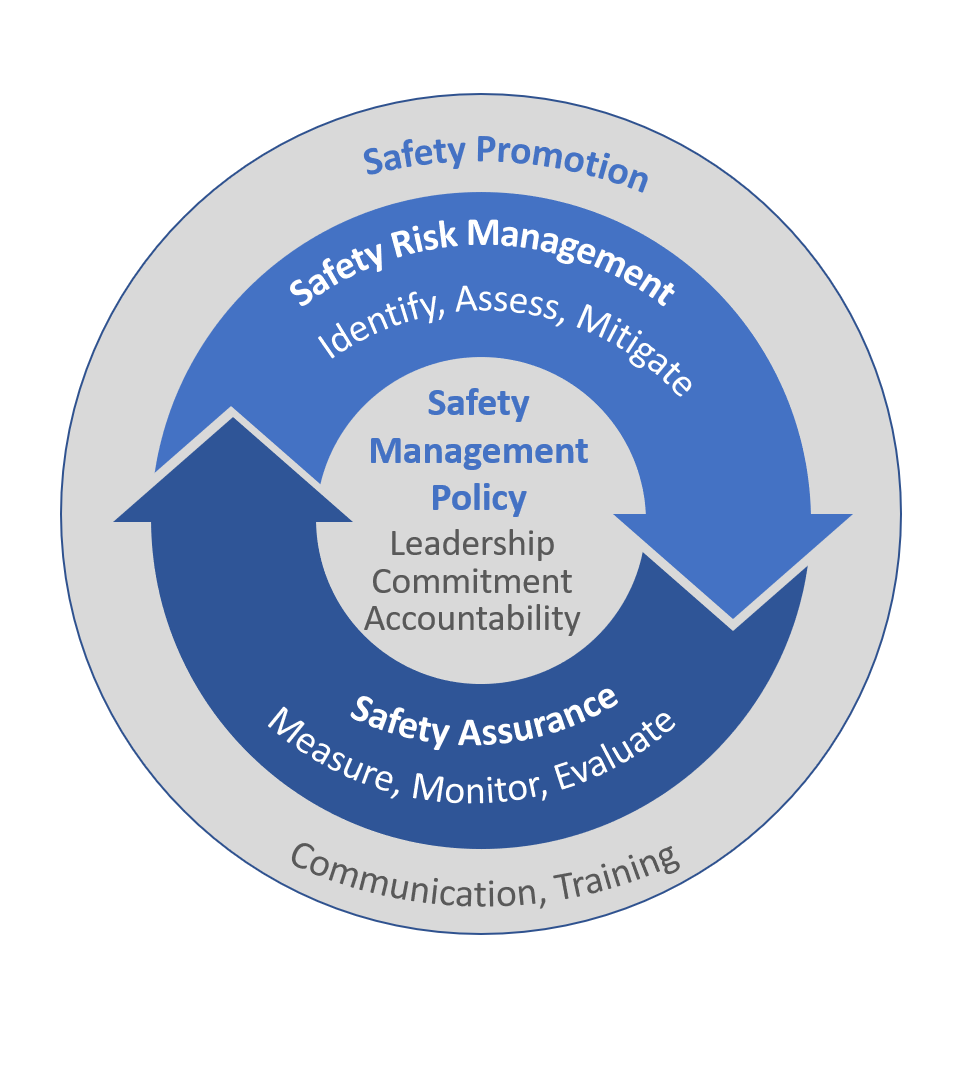
Transit Safety Management Solution (SMS)
The Transit Safety Management Solution is suite of applications that help your agency meet FTA compliance requirements for Safety Management Systems (SMS) under Public Transportation Agency Safety Plan (PTASP) regulations. Meeting FTA requirements is important, but this solution goes beyond meeting compliance and provides tools to engage your entire organization in the safety process and advanced spatial analysis to help you prioritize corrective action.
Community Engagement Solution
Communicating plans and soliciting feedback from the public can be a big challenge, especially now with COVID-19 making in-person interaction difficult (this is a virtual conference, after all). The Community Engagement Solution helps your agency adapt to changing communication trends, increase public participation in the planning process, and build community consensus.
ADA Stop Solution 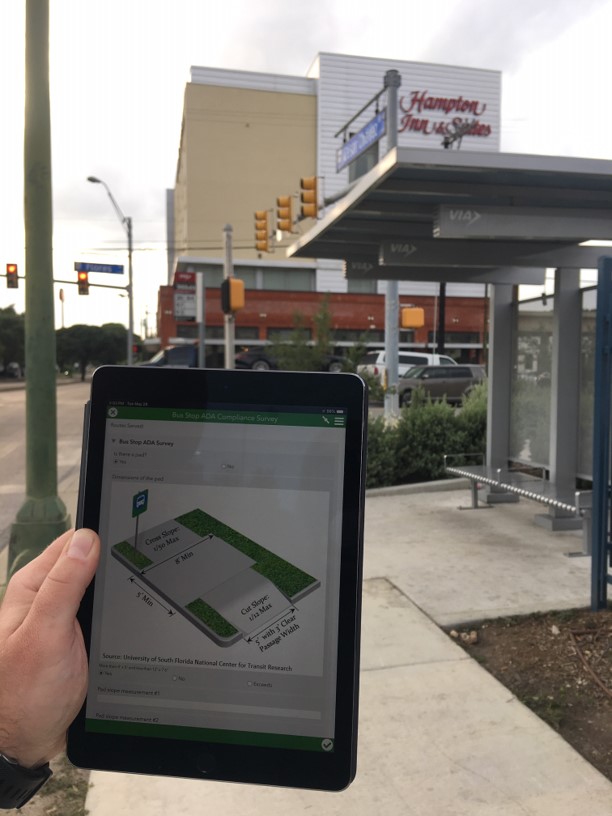
The ADA Stop Solution solves common field data collection workflow issues. The solution allows you to coordinate bus stop collection assignments, collect and quickly assess data for ADA compliance, track progress, and perform analysis to prioritize bus stop improvements. Because these are configurable applications, the ADA solution can be configured to meet any field data collection workflow.
AVL/Tracking Solution
Real-time situational awareness is important when on-time performance is at stake. The AVL Solution taps into your agency's AVL to provide real-time location monitoring of your vehicles. Knowing where vehicles are located is not useful without the context of what is happening around them, so we provide live traffic, Waze alerts, weather, traffic cameras, road construction status, and other variables to provide a comprehensive traffic management dashboard. What's more, historical data can be stored for analysis to help you discover patterns that may effect on-time performance. An example of a real-time dashboard for Honolulu can be found here. Keep in mind that this is using live operational data, so if you're looking at this at 3 A.M. Hawaii Time (GMT -10), you may not see much happening.
Customer Examples
Although our Transit Team at Esri is relatively new, we do have transit agency successes to share.
- New York MTA uses ArcGIS to help manage over $1 trillion in assets and coordinate repair efforts on the system.
- Bay Area Rapid Transit (BART) uses a location strategy with ArcGIS to efficiently provide rail service to 450,000 daily passengers.
- Valley Metro in Phoenix uses the Safety Management Solution to meet FTA requirements for SMS.
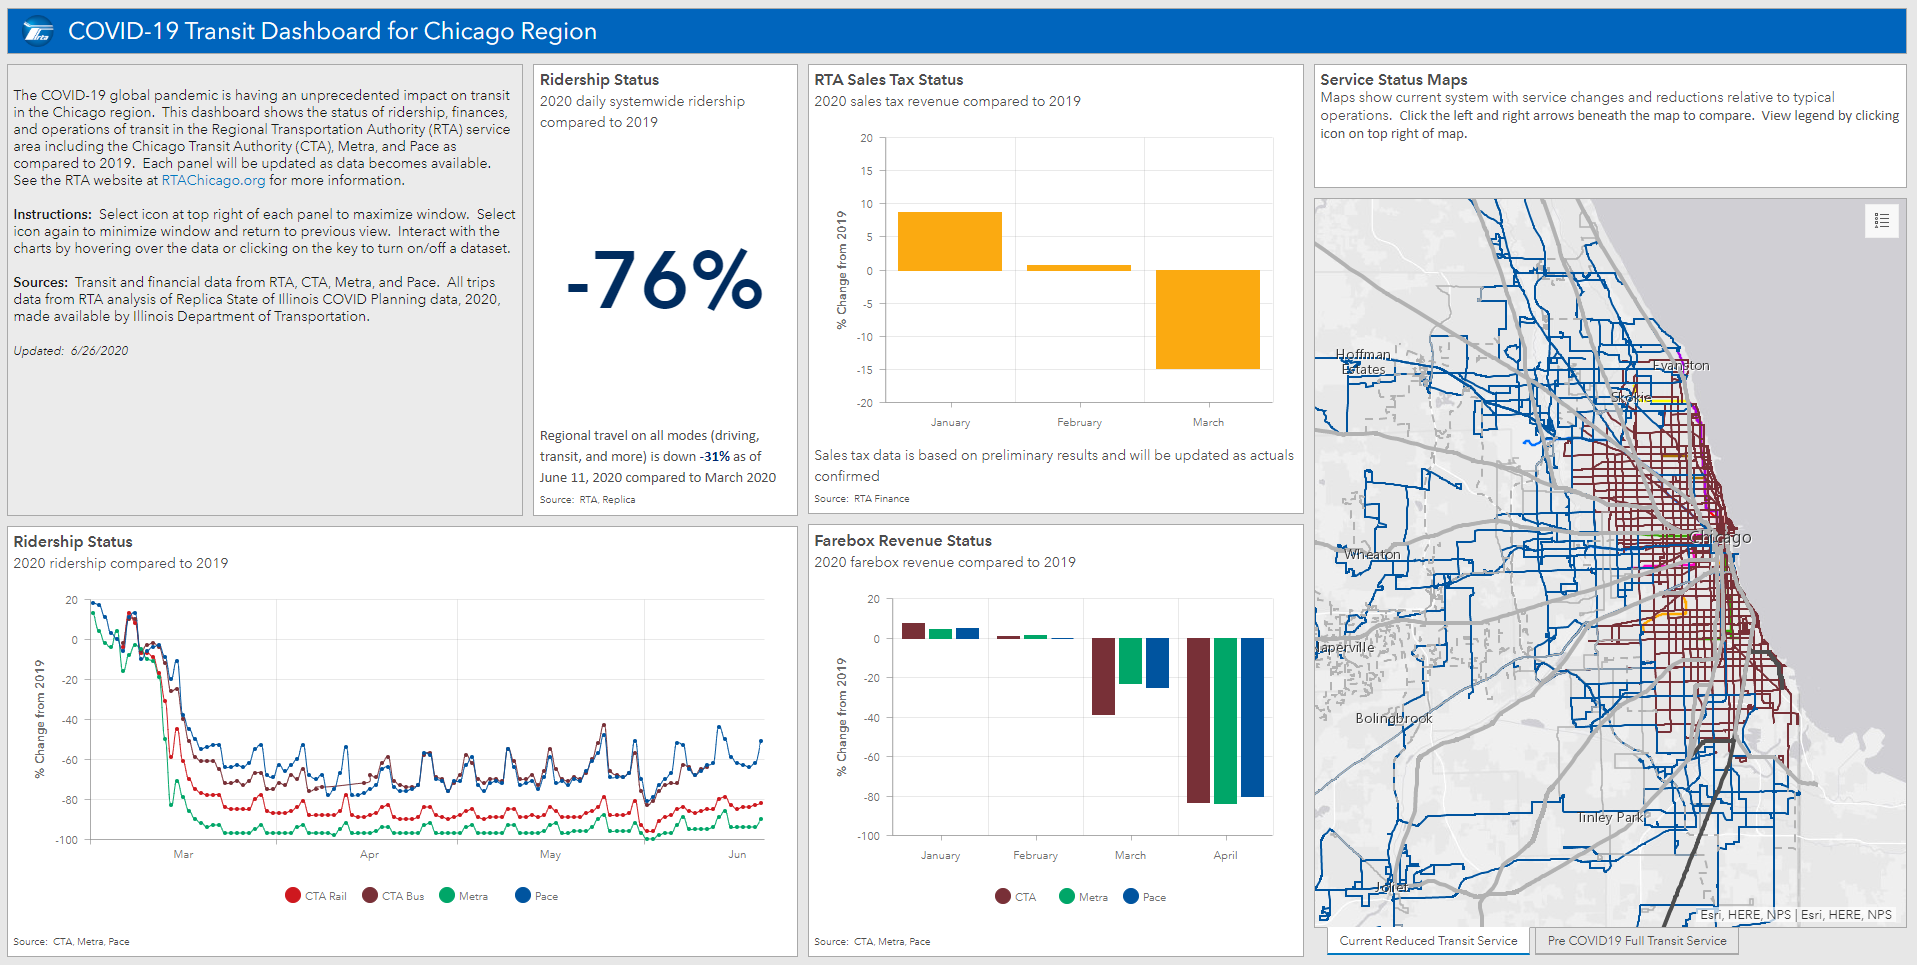
- Chicago's Regional Transportation Authority provides oversight for Chicagoland transit providers. As part of communicating COVID-related service challenges to the public and political stakeholders, they configured a COVID-19 dashboard with ridership and funding information.
- The Regional Transportation Alliance (RTA) of Southwestern Pennsylvania is a coalition of public and private partners in the Pittsburgh area that facilitates an ongoing regional discussion to support the realization of additional transportation projects that will enhance regional connectivity, competitiveness and quality of life. As part of that communication effort, they have configured over 50 (wow!) ArcGIS Story Maps to communicate various projects and plans, including this Story Map for the Imagine Transportation 2.0 vision.
- We've curated a gallery of public-facing transit applications. Here you can browse applications that other transit agencies are using to communicate with the public.
System of Engagement
For those that want to develop a location strategy, we are commonly asked "how do we move forward?', "where do we start", or "how do we create a plan?" To help answer those questions, we offer the System of Engagement. The System of Engagement includes a business needs and technical track discovery. As a result, you are provided with a plan that documents the needs that were uncovered, and the application(s) needed to move ahead. Because it is your plan, you may choose to implement the recommendations in-house at your own pace or use Esri Professional Service or an Esri technology partner to implement the plan. We have done a number of these engagements with Transit Agencies and DOTs throughout the US. A list of some applications that came out of those transit engagements can be found here. For more information about the System of Engagement, check out the video available at the "Smart Mobility-Transit" virtual kiosk at the UC.
The Transit Team hopes you enjoy the User Conference this year. We would love to hear from you. Please check out the Transportation virtual kiosk during UC or reach out directly. You can reach us at transit@esri.com.
For transit-related sessions and events at this year's UC, check out this flyer.