Introduction
Organizations often require a certain level of system uptime for their ArcGIS Enterprise deployments, such as 99 percent of the time or higher. For these organizations, implementing a strategy to ensure high availability is crucial.
High Availability (HA), while related to Disaster Recovery (DR), is a separate concept. Generally, HA is focused on avoiding downtime for service delivery, whereas DR is focused on retaining the data and resources needed to restore a system to a previous acceptable state after a disaster.
This post will focus on best practices to configuring local load balancer (Local Traffic Manager, LTM) in a single location for high availability, and will not include considerations to configuring Global Traffic Manager (GTM) for automatic failover between different locations.
To achieve high availability, you must reduce single points of failure through duplication and load balancing.
Load balancers act as a reverse proxy and distribute traffic to back-end servers. Third-party load balancer is required in a highly available ArcGIS Enterprise deployment to improve the capacity and reliability of the software. They handle client traffic to your portal and server sites, as well as internal traffic between the software components.
ArcGIS Web Adaptor
Though ArcGIS Web Adaptor is considered a load balancer, it’s inadequate to serve as the lone load balancer in a highly available deployment, since ArcGIS Web Adaptor also requires redundancy to achieve high availability.
ArcGIS Web Adaptor is an optional component, as load balancers can forward requests directly to your portal and server sites, yet it is a recommended component. The advantages of using web adaptors are:
- It provides an easy way to configure a single URL for the system
- It allows you to choose context names for the different system components, e.g. portal, server, mapping, etc.
- It is integrated natively with other ArcGIS Enterprise software components, the portal and server sites, and will automatically handle health checks and configuration tasks, e.g. adding new machine to a server site
Web Context URL
The web context URL is the public URL for the portal. Since any item in portal has a URL - file, layer, map, and app, the portal's WebContextURL property helps it construct the correct URLs on all resources it sends to the end user.
External Access and DNS
ArcGIS Enterprise portal supports only one DNS for public portal URL (the web context URL), and currently there is no supported way to change the web context URL without redoing administrative tasks, e.g. federating server sites with your portal. If your ArcGIS Enterprise requires external access, e.g. to allow access to mobile users, contractors, partners, or agencies, without VPN, or if you anticipate that you will need to allow external access in the future, you must use an externally resolvable DNS name for the portal’s web context URL, e.g. https://gis.company.com/portal.
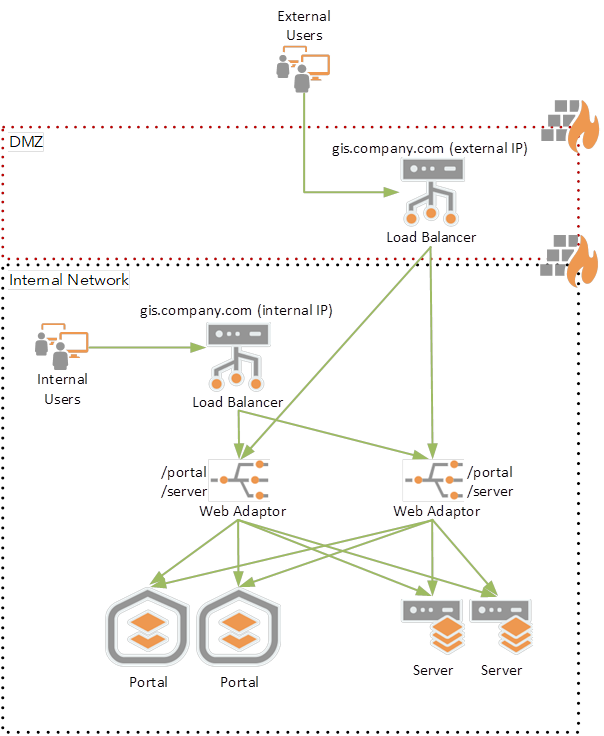
To secure external access to ArcGIS Enterprise, it is common to host a load balancer in a DMZ, and implement a Split Domain Name System (Split DNS), i.e. internal access to ArcGIS Enterprise DNS (e.g. gis.company.com) will be resolved to an internal load balancer IP, so internal users will stay behind the firewall, and external access to ArcGIS Enterprise DNS will be resolved to an external (DMZ) load balancer IP.
URLs used in federation
Several different URLs are used in a highly available ArcGIS Enterprise deployment.
Services URL
This is the URL used by users and client applications to access ArcGIS Server sites. It’s the URL for the load balancer that handles ArcGIS Server traffic and passes requests either to the server site’s Web Adaptor or directly to the server machines.
Administrative URL
This URL is used by administrators, and internally by the portal, to access an ArcGIS Server site when performing administrative operations. This URL is also used for publishing GIS services with reference to a registered data store, e.g. SQL Server enterprise geodatabase, to a federated server site. This must direct to a load balancer; if the administrative URL points to a single machine in the server site and that machine is offline, federation will not work. This can be the same URL as the services URL or can be a second load balancer (VIP) for each federated server site admin URL via port 6443. Configuring a dedicated VIP for each federated server site admin URL via port 6443 will require to open this port for administrators and publishers, and you can disable administrative access through the web adaptor, thus providing additional security controls for the organization.
I recommend using the same URL as the services URL since it simplifies configuration. ArcGIS Server administrative access will be controlled by ArcGIS Enterprise authentication and user roles, similarly to administrative access to portal, e.g. ArcGIS Portal Directory (portaladmin) and Organization Settings. To use web adaptor URL for administrative URL, you must enable administrative access in the server web adaptor.
Private portal URL
This is an internal URL used by your server sites to communicate with the portal. This must also direct to a load balancer and should be defined prior to federating. If you federate your server sites prior to setting the privatePortalURL, follow step 8 and 9 in the topic Configure an existing deployment for high availability to update the URL within your deployment. Similar to the administrative URL, this can be the same as the public URL for the portal (portal’s web context URL), or it can be a second load balancer (VIP) via port 7443.
For configuration simplicity, I would recommend using the public URL for the portal for the private portal URL. If you choose to use a dedicated load balancer VIP via port 7443 for private portal URL, you should configure the load balancer to check the health of the portal machines.
Load Balancer Configuration
Health Check Settings
The most important capability to use is a Health Check. As described in portal’s health check documentation:
“The health check reports if the responding Portal for ArcGIS machine is able to receive and process requests. For example, before creating the portal, the health check URL reports the site is unavailable because it can't take requests at that time.”
ArcGIS Enterprise portal and server have health checks.
When you use ArcGIS Web Adaptors, the web adaptors will take care of performing the health checks against the portal and the servers. In this case you can configure the load balancer with basic TCP/443 health check or a static page health check, with standard health check settings for timeout, failure trigger, polling interval, and healthy threshold.
If you configure the load balancer to access portal and/or the servers directly, e.g. if you don’t include web adaptors in your architecture, or if you use dedicated load balancer URL for private portal URL (port 7443) or federated server administrative URL (port 6443), you should configure the load balancer to check the health of the portal and server machines.
There are some important considerations about health check settings on the load balancer. Most organizations using a load balancer use a static page as their health check (e.g. index.html) to determine whether the web server is healthy. This is a static file that only requires a disk fetch. Also, most web servers tend to bottleneck with I/O rather than CPU.
However, Esri’s ArcGIS Server is different in that our health check requires a very small amount of CPU because our check is more than just a disk fetch, as the software needs to determine whether certain processes are functional.
With health checks there is a timeout value on the poll. Most load balancer administrators set the timeout value very low because disk fetches are usually very fast (though they often leave some buffer for poor network latency).
When using a low timeout value with ArcGIS Server and when using a multi-machine setup, there is a chance one of the machines may exceed the low timeout value and a healthy machine will be removed.
Esri recommends a higher timeout value, ideally at least 5 seconds. Depends on the system, you might need to increase this value even more. You should monitor your environment and adjust this value accordingly. This may seem like a high number to Network Administrators since a health check on a simple page usually takes less than 10ms normally (plus network latency).
However, it is critical for the load balancers to distinguish between when a machine is just slow vs. when a machine is truly dead and non-responsive. If portal or server is truly down and not listening on a port at all, most load balancers will detect this even sooner than 5 seconds, so this timeout does not impact "normal" failures where a machine goes away.
The second consideration is the failure trigger - how many times does the poll need to fail before removing the machine from the load balancer.
As a rule, Network Administrators set the failure trigger to be more than 1 failure because they do not want a single network glitch to take down the system. As noted above, a small spike in CPU usage (which is common on ArcGIS Server systems) can cause a timeout, and it is not desirable to bring down a machine because of a single CPU spike on a single machine.
Esri has done significant internal testing with load balancers and found that a setting of 5 failures dramatically reduced the number of false positives while still detecting true outages. We found that a value of 3 was still highly susceptible to false positives.
The third consideration is the polling interval. Esri has found that 30 second polling intervals, coupled with 5 failures was a sweet spot of detecting true failures and ignoring false positives.
With this combination, the expected value (using a statistics term) or mean time to detection is 1 minute and 15 seconds of downtime before detection, with a worse case of 2 minutes and 30 seconds. It is possible to aim for a lower mean time to detection, but the trade-off is receiving false positives.
If the lower mean time to detection is preferred, it may be needed to increase capacity so there are sufficient resources to suffer a true failure on a machine and a false positive without overloading the remaining machines.
The final setting regarding health checks is the healthy threshold for the load balancer to start sending requests again. Esri does not have a recommendation for this and we have not observed many differences in this number, but we typically see 3 healthy consecutive polls before rejoining.
Throttling
Throttling settings are worth considering. ArcGIS Server is CPU-bound which means most of the request time is spent using the CPU rather than waiting for I/O.
This means if there are 8 cores, ArcGIS Server can handle a little more than 8 simultaneous requests from a practical standpoint. If ArcGIS Server is busy, it starts queueing requests until there are hundreds of requests in line, and after that threshold it refuses connections. When there is a long backlog of requests it will result in a long wait time, but eventually the request gets processed.
ArcGIS Server has settings to control this behavior, so there are less of these abandoned requests being worked on, but it is also a best practice to control this at the load balancer level via its ability to throttle.
Esri does not have a numerical recommendation because it depends a lot on the specific architecture and the types of requests coming in, but it is typical to throttle at a significant lower value than Network Admins would typically do for a Web Server.
This is beyond the control of the Network Administrator, but the client applications should be written to handle a throttling event and do re-tries in increasing time intervals (e.g. first time you can immediately re-try, second time you wait a second, third re-try wait 5 seconds, etc.).
Sticky Sessions
Esri does not recommend sticky sessions except in very rare circumstances. Sticky sessions can theoretically overload a machine. Esri has conducted load tests using sticky sessions to see if we found results that would overload our GIS Server, and this did not occur. We have also not received any customer complaints. That said, since our software is stateless we do not see the value in using sticky sessions.
Layer 4 vs. Layer 7
The final setting to mention is whether the load balancer does a "level 7" approach or a "layer 4" approach. This can be a debate among Network Administrators, but below is a concise summary of the situation describing the differences and advantages of each.
A layer 7 load balancer understands http and https, it therefore decrypts https content and then re-encrypts it. Because it understands http and https it can cache content and save requests going to the backend server.
A layer 4 load balancer views all the traffic as TCP packets and has no idea what the packets mean; they could be for ftp, https, smtp, but this does not matter to a layer 4 load balancer. As a result, it doesn't need to understand the http payload and can be faster.
ArcGIS Server can work with either approach and there is no recommendation on this setting for Network Admins, but there are some pieces of information that an Admin will want to be aware of.
ArcGIS Server payloads can be much larger than HTML pages, CSS, and JS content (the actual amount would be useful but is often dependent on the data the customer uses). This means there is more CPU load on a layer 7 load balancer decrypting and encrypting on a per-request basis.
Also, since much of ArcGIS Server data is dynamic and frequently changing, by default cache headers prohibit caching on the client and load balancer. If the data doesn't change much and the customer wants to use a layer 7 load balancer, they can change and control these cache settings.
Summary of Recommendations
Health Check
- If you configure your load balancers with ArcGIS Web Adaptors, you can configure the load balancer with basic TCP/443 health check or a static page health check against the web servers
- If you configure the load balancer to access portal and/or the servers directly (via ports 6443 and 7443), use HTTPS health check endpoint:
- Portal:
- Server:
- Use a higher health check timeout value, at least 5 seconds
- Use a value of 5 for the failure trigger
- Use 30 second polling intervals
- Use 3 healthy consecutive polls before rejoining
Throttling
- Use a throttle setting at a significant lower value than typical web servers
Sticky Sessions
- Do not use sticky sessions
Certificates
ArcGIS Enterprise components come pre-configured with a self-signed server certificates, which allows the software to be initially tested and to help you quickly verify that your installation was successful. However, in almost all cases, an organization should request a certificate from a trusted certificate authority (CA) and configure the software to use it. The certificate can be signed by a corporate (internal) or commercial CA. Commercial CA (known-CA) must be used for externally resolvable DNS, e.g. load balancer VIP DNS; internal domain certificates can be used for internal servers.
For ArcGIS Enterprise system with externally resolvable DNS, if the load balancer’s SSL method is SSL-passthrough (the load balancer does not decrypt and re-encrypt https content), it does not require certificate, and a commercial CA certificate must be installed on the mapped servers (e.g. web servers where the web adaptors are installed). If the load balancer’s SSL method is SSL re-encryption, a commercial CA certificate must be installed on the load balancer.