- Home
- :
- All Communities
- :
- Products
- :
- Geoprocessing
- :
- Geoprocessing Questions
- :
- Re: Calculate max number of non-overlapping polygo...
- Subscribe to RSS Feed
- Mark Topic as New
- Mark Topic as Read
- Float this Topic for Current User
- Bookmark
- Subscribe
- Mute
- Printer Friendly Page
Calculate max number of non-overlapping polygons
- Mark as New
- Bookmark
- Subscribe
- Mute
- Subscribe to RSS Feed
- Permalink
There is a proposed ordinance that would allow an activity on a property so long as it is a specified minimum distance (parcel edge to parcel edge) from another property with the activity (let's say 500 ft). I need to figure out the theoretical maximum number of properties that could allow this activity. I have all the eligible parcels selected (which is tens of thousands). I could put a half-distance (250 ft) buffer on every one of them, which of course would result in massive overlap. But if there's a way to strategically eliminate buffers to get maximum coverage with no overlap, that would be exactly what I need! Or is there a better, totally different approach to this? Thank you for any insight!
Solved! Go to Solution.
Accepted Solutions
- Mark as New
- Bookmark
- Subscribe
- Mute
- Subscribe to RSS Feed
- Permalink
OK, as promised, find below the code that I used:
#-------------------------------------------------------------------------------
# Name: parcel_analysis.py
# Purpose:
#
# Author: Xander
#
# Created: 13-05-2017
#-------------------------------------------------------------------------------
import arcpy
def main():
import os
arcpy.env.overwriteOutput = True
fc = r'C:\GeoNet\ParcelAnalysis\data.gdb\Parcels_selected'
fc_out = r'C:\GeoNet\ParcelAnalysis\data.gdb\Parcels_final_oid17'
oid_init = 17 # 67 # the OID of the parcel where to start
buf_size = 150 # distance setting, in my example in meters
oids = [oid_init] # list of oids for the selected parcels
oids_popped = [] # list of excluded parcels
# for checking the expanded area per iteration
feats = []
fc_buf = r'C:\GeoNet\ParcelAnalysis\data.gdb\Parcel_buffers_oid17'
# create a dictionary with oid vs parcel polygons
flds = ('OID@', 'SHAPE@')
dct_pol = {r[0]: r[1] for r in arcpy.da.SearchCursor(fc, flds)}
# get initial parcel and apply buffer
pol_init = dct_pol[oid_init]
buf_init = pol_init.buffer(buf_size)
feats.append(buf_init)
# remove parcels that are in the buffer
dct_pol, dct_next, oids_popped = RemovePolygons(dct_pol, buf_init, buf_size, oids_popped)
# iterations
buf_pol = buf_init
iteration = 0
while len(dct_next.keys()) > 0:
iteration += 1
print " - iteration:", iteration
# based on buffer area and potential next parcels, select "best" option
oid_min = GetNextPolgon(dct_next, buf_pol, buf_size)
if oid_min is None:
break
oids.append(oid_min)
pol_min = dct_next[oid_min]
# update the buffer polygon including the buffer of the next selected parcel
buf_pol = UpdateBufferPolygon(buf_pol, pol_min, buf_size)
feats.append(buf_pol)
# remove the polygons that are within the expanded buffer
dct_pol, dct_next, oids_popped = RemovePolygons(dct_pol, buf_pol, buf_size, oids_popped)
# write the buffers for each step
arcpy.CopyFeatures_management(feats, fc_buf)
# create the output final parcels featureclass
flds = ('OID@', 'SHAPE@')
feats_fin = [r[1] for r in arcpy.da.SearchCursor(fc, flds) if r[0] in oids]
arcpy.CopyFeatures_management(feats_fin, fc_out)
# print "\n", GetWhere(oids_popped)
print "\nOID's final parcels:\n", GetWhere(oids)
def GetWhere(oids):
# print the list of oid's so you can use it in a where clause
oid_where = ', '.join([str(o) for o in oids])
oid_where = "({0})".format(oid_where)
return oid_where
def RemovePolygons(dct, buf_pol, buf_size, oids_popped):
# remove the polygons that are in the buffer
# and generate a dict with next parcels to evaluate
dct_next = {}
for oid, polygon in dct.items():
if polygon.distanceTo(buf_pol) <= 0:
bla = dct.pop(oid)
oids_popped.append(oid)
elif polygon.distanceTo(buf_pol) <= buf_size:
dct_next[oid] = polygon
return dct, dct_next, oids_popped
def GetNextPolgon(dct, buf_pol, buf_size):
# get the next parcel based on the smallest increment of the buffer polygon
min_size = 99999999
min_oid = None
for oid, polygon in dct.items():
pol_i_buf = polygon.buffer(buf_size)
pol_tmp = pol_i_buf.union(buf_pol)
if pol_tmp.area < min_size:
min_oid = oid
min_size = pol_tmp.area
return min_oid
def UpdateBufferPolygon(buf_pol, pol_min, buf_size):
# update the buffer polygon with the next buffered parcel
buf_add = pol_min.buffer(buf_size)
new_pol = buf_pol.union(buf_add)
return new_pol
if __name__ == '__main__':
main()I did a few scenarios, starting with different OID's and one should evaluate which starting parcel will get the best result. The red circle indicates the parcel where the iterations started:


- Mark as New
- Bookmark
- Subscribe
- Mute
- Subscribe to RSS Feed
- Permalink
This sounds like you really need a Point Distance tool for polygons. (Unfortunately, one does not exist.)
If you're willing to get into arcpy Geometry objects, the DistanceTo operator would allow you to measure that edge-to-edge distance directly. You'd want to first select by an extent envelope (say using the "from" features extent envelope + buffer distance) so you wouldn't have to calculate from-to for 10,000 x 10,000 polygons.
Geometry—Help | ArcGIS Desktop
I think you could successfuly use the resulting data to answer your questions without the extreme processing load of all the buffers and interesects.
- Mark as New
- Bookmark
- Subscribe
- Mute
- Subscribe to RSS Feed
- Permalink
My initial impression is that this problem is more complicated than how it is presented. To find a true maximum, it is an optimization mathematics problem in addition to a GIS problem. Given that not every parcel is eligible, and I am guessing that eligible and non-eligible parcels are intermixed at some level, the parcels that get the activity first will drive the final outcome. If different parcels are chosen first, likely different outcomes.
Instead of trying to find the true/theoretical maximum, which is likely a very challenging problem, would it suffice to find a ballpark or likely/probable outcome? For the latter, you could run a couple of tens of scenarios where you start seeding the activity randomly across the eligible parcels and then find how many eventually end up fitting within the criteria.
- Mark as New
- Bookmark
- Subscribe
- Mute
- Subscribe to RSS Feed
- Permalink
If I understand the problem, then you could also try simply using a negative buffer distance (i.e. -250 m) and only those parcels large enough will have buffer fragments remaining within them.
- Mark as New
- Bookmark
- Subscribe
- Mute
- Subscribe to RSS Feed
- Permalink
I think I'm getting close, although my method might no yield the absolute best possible case. One should probably test with several options and compare the results.
In map below, the green parcels meet the required condition and the blue ones get selected based on the minimum distance between parcels, using a manually selected polygon as the starting point (blue parcel in red circle).
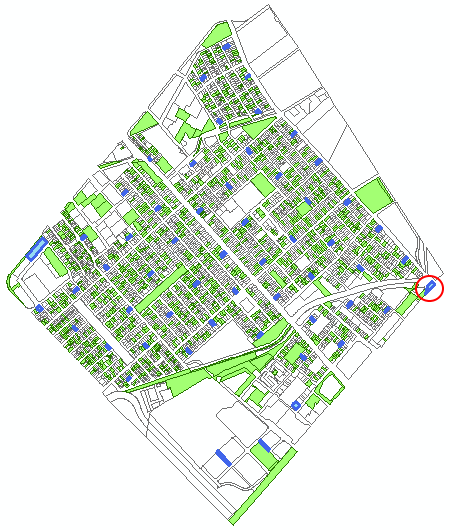
I will post some Python code and explanation tomorrow.
- Mark as New
- Bookmark
- Subscribe
- Mute
- Subscribe to RSS Feed
- Permalink
OK, as promised, find below the code that I used:
#-------------------------------------------------------------------------------
# Name: parcel_analysis.py
# Purpose:
#
# Author: Xander
#
# Created: 13-05-2017
#-------------------------------------------------------------------------------
import arcpy
def main():
import os
arcpy.env.overwriteOutput = True
fc = r'C:\GeoNet\ParcelAnalysis\data.gdb\Parcels_selected'
fc_out = r'C:\GeoNet\ParcelAnalysis\data.gdb\Parcels_final_oid17'
oid_init = 17 # 67 # the OID of the parcel where to start
buf_size = 150 # distance setting, in my example in meters
oids = [oid_init] # list of oids for the selected parcels
oids_popped = [] # list of excluded parcels
# for checking the expanded area per iteration
feats = []
fc_buf = r'C:\GeoNet\ParcelAnalysis\data.gdb\Parcel_buffers_oid17'
# create a dictionary with oid vs parcel polygons
flds = ('OID@', 'SHAPE@')
dct_pol = {r[0]: r[1] for r in arcpy.da.SearchCursor(fc, flds)}
# get initial parcel and apply buffer
pol_init = dct_pol[oid_init]
buf_init = pol_init.buffer(buf_size)
feats.append(buf_init)
# remove parcels that are in the buffer
dct_pol, dct_next, oids_popped = RemovePolygons(dct_pol, buf_init, buf_size, oids_popped)
# iterations
buf_pol = buf_init
iteration = 0
while len(dct_next.keys()) > 0:
iteration += 1
print " - iteration:", iteration
# based on buffer area and potential next parcels, select "best" option
oid_min = GetNextPolgon(dct_next, buf_pol, buf_size)
if oid_min is None:
break
oids.append(oid_min)
pol_min = dct_next[oid_min]
# update the buffer polygon including the buffer of the next selected parcel
buf_pol = UpdateBufferPolygon(buf_pol, pol_min, buf_size)
feats.append(buf_pol)
# remove the polygons that are within the expanded buffer
dct_pol, dct_next, oids_popped = RemovePolygons(dct_pol, buf_pol, buf_size, oids_popped)
# write the buffers for each step
arcpy.CopyFeatures_management(feats, fc_buf)
# create the output final parcels featureclass
flds = ('OID@', 'SHAPE@')
feats_fin = [r[1] for r in arcpy.da.SearchCursor(fc, flds) if r[0] in oids]
arcpy.CopyFeatures_management(feats_fin, fc_out)
# print "\n", GetWhere(oids_popped)
print "\nOID's final parcels:\n", GetWhere(oids)
def GetWhere(oids):
# print the list of oid's so you can use it in a where clause
oid_where = ', '.join([str(o) for o in oids])
oid_where = "({0})".format(oid_where)
return oid_where
def RemovePolygons(dct, buf_pol, buf_size, oids_popped):
# remove the polygons that are in the buffer
# and generate a dict with next parcels to evaluate
dct_next = {}
for oid, polygon in dct.items():
if polygon.distanceTo(buf_pol) <= 0:
bla = dct.pop(oid)
oids_popped.append(oid)
elif polygon.distanceTo(buf_pol) <= buf_size:
dct_next[oid] = polygon
return dct, dct_next, oids_popped
def GetNextPolgon(dct, buf_pol, buf_size):
# get the next parcel based on the smallest increment of the buffer polygon
min_size = 99999999
min_oid = None
for oid, polygon in dct.items():
pol_i_buf = polygon.buffer(buf_size)
pol_tmp = pol_i_buf.union(buf_pol)
if pol_tmp.area < min_size:
min_oid = oid
min_size = pol_tmp.area
return min_oid
def UpdateBufferPolygon(buf_pol, pol_min, buf_size):
# update the buffer polygon with the next buffered parcel
buf_add = pol_min.buffer(buf_size)
new_pol = buf_pol.union(buf_add)
return new_pol
if __name__ == '__main__':
main()I did a few scenarios, starting with different OID's and one should evaluate which starting parcel will get the best result. The red circle indicates the parcel where the iterations started:
- Mark as New
- Bookmark
- Subscribe
- Mute
- Subscribe to RSS Feed
- Permalink
Wow, thank you, Xander! I tried it on a sample section of my data and it does exactly what I need! I'm nowhere close to proficient enough with Python to create a script like that. And thank you to everyone on this thread for responding so quickly!
- Mark as New
- Bookmark
- Subscribe
- Mute
- Subscribe to RSS Feed
- Permalink
You're welcome.Could you mark the post that answered your questions as the correct answer?
If you need some more detailed explanation on what is going on in the script, just let me know.
- Mark as New
- Bookmark
- Subscribe
- Mute
- Subscribe to RSS Feed
- Permalink
Xander, nice work. I knew it was possible to use this method, but armed with this example when I need to do something like this I'll have some great code to steal from. I'm hoping this nifty polygon to polygon distance example will be helpful to others too! Vote this guy up!
- Mark as New
- Bookmark
- Subscribe
- Mute
- Subscribe to RSS Feed
- Permalink
Xander Bakker, nice work addressing the GIS portion of the problem. Once the GIS portion is addressed, then comes the operations research or optimization portion of the question, i.e., what is the true maximum parcels and what configuration represents that true maximum.
I did some futzing over the weekend. Since the OP didn't upload any sample data, I decided to use Esri's backyard: City of Redlands Open Data: Open Data Zoning. To simplify the problem, and to not get into the issue of property records directly, I decided to use Zoning units in the central part of Redlands around Esri's campus.

I made the following assumptions:
- Parcels/geometries for consideration are Single-Family Residential (sample size - 71)
- Activity cannot be allowed within 500 ft. of parcel that already allows activity (buffer distance)
- No restrictions between adjacent Single-Family Residential and other zoning categories (edge condition)
I didn't have time to apply a true optimization model, so I thought it would be interesting to look at some basic simulations. The general approach:
- Randomly select first parcel
- Add parcel OID to selection list
- Create spatial selection polygon
- Randomly select next parcel
- Buffer selected parcel 500 ft.
- if parcel is disjoint with spatial selection polygon:
- Add parcel OID to selection list
- Union parcel with spatial selection polygon
- if parcel is disjoint with spatial selection polygon:
- Buffer selected parcel 500 ft.
- Repeat step 2 until sample size exhausted.
- Repeat steps 1 through 3 for x number of simulations
There are likely ways to optimize the compute time of the approach above, but I didn't bother to spend the time since my approach could simulate 1,000 scenarios in a few minutes.
Since 1,000 scenarios ran fairly quick, I just did that and 10,000 scenarios. For the 1,000 scenario runs I did, I always ended up with 1,000 unique outcomes. For the 10,000 scenario runs I did, I would typically end up with 9,980 or so unique outcomes.
Looking at one of the 10,000 scenario runs, the outcomes breakdown to:
| Number Parcels in Solution/Outcome | Prevalence |
|---|---|
| 10 | 20 |
| 11 | 100 |
| 12 | 442 |
| 13 | 1164 |
| 14 | 2104 |
| 15 | 2533 |
| 16 | 2139 |
| 17 | 1098 |
| 18 | 335 |
| 19 | 43 |
Looking at the distribution of solutions is interesting in its own right. It appears the minimum number of parcels that meet the conditions is likely 10. There might be a 9 solution out there somewhere, but would decisions based on this information change much whether the minimum is 9 or 10? On the opposite end, the maximum number of parcels that meet the condition is likely 19. Similar to the minimum, there may be a 20 or 21 solution that exists, but does knowing the true maximum gain much.
Assuming for the sake of discussion that 19 is the maximum number of parcels that meet the conditions, 43 different combinations were found that provide 19 parcels. Looking just at the prevalence of individual parcels in those 43 combinations:

Looking at the graphic, you can see there are 4 parcels that are in all of the 43 combinations, and 3 of those 4 are adjacent to other zoning categories. Since there is no penalty for being adjacent to other zoning categories, it makes sense that the higher prevalence parcels are scattered around the boundaries of the block of single-family residential parcels.
Getting back to my original comment to the OP, this is much more than just a GIS question. Since allowed activities will likely be approved on a first-come-first-approved basis, each time an activity is approved for a given parcel, it influences how many total parcels might be selected in the end. Looking back at the table of results, there are 20 outcomes that would only allow for 10 parcels to be selected.