- Home
- :
- All Communities
- :
- Industries
- :
- Education
- :
- Education Blog
- :
- Where does Thanksgiving Dinner come from? Story m...
Where does Thanksgiving Dinner come from? Story map
- Subscribe to RSS Feed
- Mark as New
- Mark as Read
- Bookmark
- Subscribe
- Printer Friendly Page
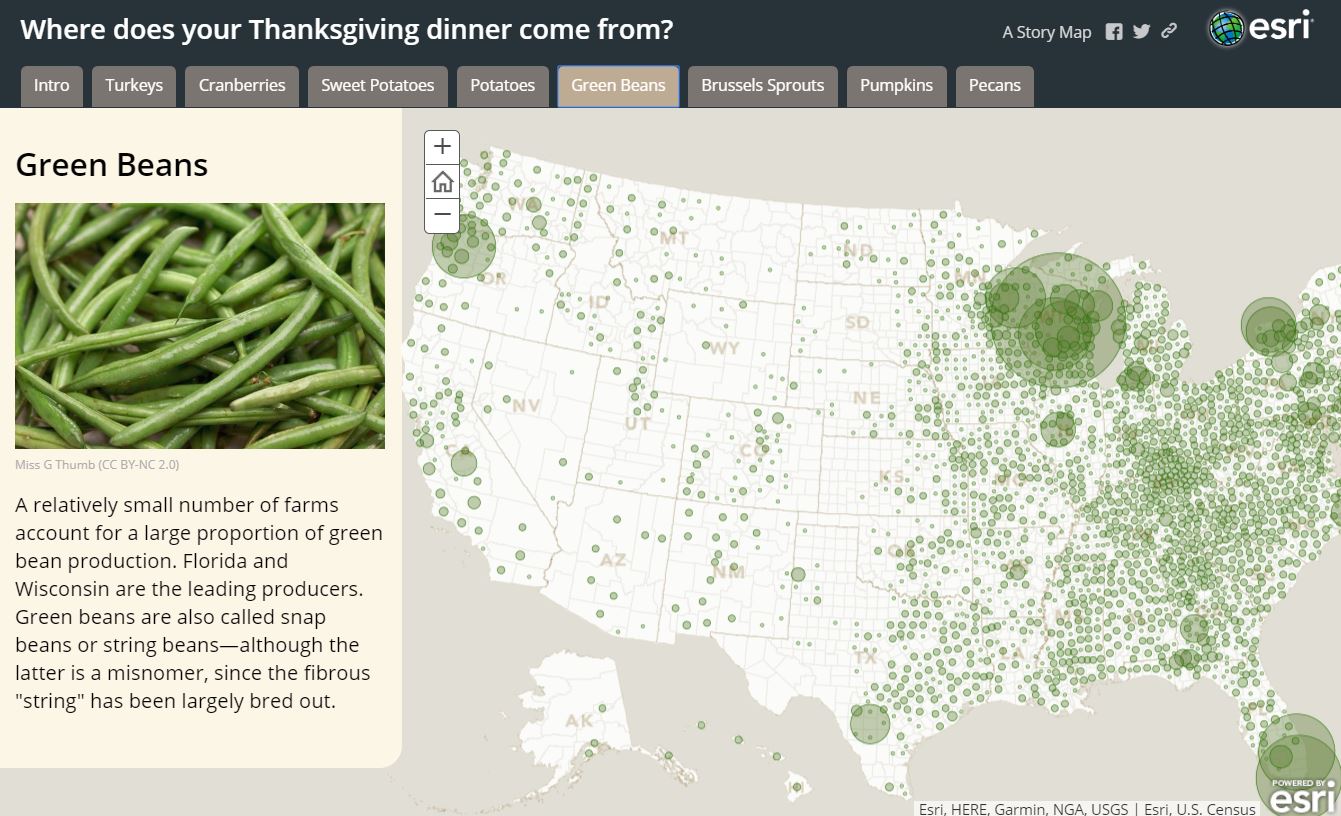
Greetings all and, if you are in the USA, Happy Thanksgiving. This “where does Thanksgiving dinner come from” story map: https://storymaps.esri.com/stories/2017/thanksgiving-dinner/ could be useful for many reasons:
1) Like many good maps, it is great for examining spatial patterns, and also for challenging some preconceived notions (did you know that Wisconsin was so prominent in growing green beans, for example?).
2) The excellent use of symbols and other cartographic techniques might be useful discussion points in geography, GIS, and cartography courses.
3) Examine the metadata--this map was created from data from the USDA Census of Agriculture. How did the data get compiled?
4) How can you create a series type of story map like this one, on your own topic of interest?
5) Use this map to spark some “spatial” discussions with your friends and family. Enjoy. And thank a farmer!
--Joseph Kerski
You must be a registered user to add a comment. If you've already registered, sign in. Otherwise, register and sign in.
-
Administration
90 -
Announcements
88 -
Career & Tech Ed
1 -
Curriculum-Learning Resources
286 -
Education Facilities
24 -
Events
77 -
GeoInquiries
1 -
Higher Education
618 -
Informal Education
286 -
Licensing Best Practices
102 -
National Geographic MapMaker
43 -
Pedagogy and Education Theory
241 -
Schools (K - 12)
282 -
Schools (K-12)
308 -
Spatial data
39 -
STEM
3 -
Students - Higher Education
259 -
Students - K-12 Schools
147 -
Success Stories
44 -
TeacherDesk
1 -
Tech Tips
129
- « Previous
- Next »