Turn on suggestions
Auto-suggest helps you quickly narrow down your search results by suggesting possible matches as you type.
Cancel
- Home
- :
- All Communities
- :
- Industries
- :
- Education
- :
- Education Blog
- :
- Weird Earth: Exploring the Earth With Interesting,...
Weird Earth: Exploring the Earth With Interesting, Bizarre, and Odd Imagery
Subscribe
1750
0
02-24-2012 12:48 AM
- Subscribe to RSS Feed
- Mark as New
- Mark as Read
- Bookmark
- Subscribe
- Printer Friendly Page
02-24-2012
12:48 AM
Take a look at this image.
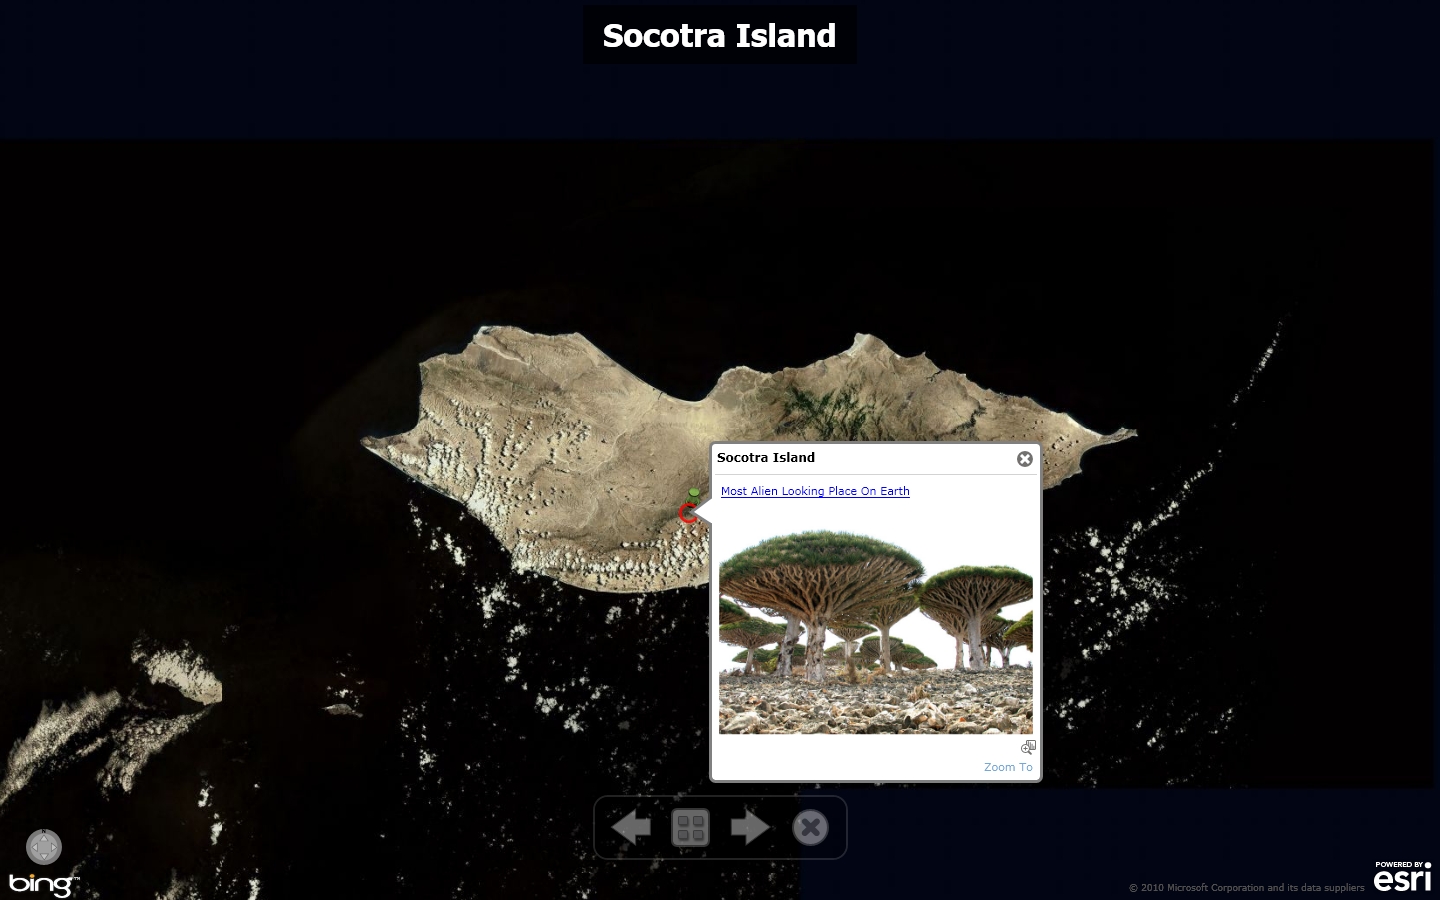
Where is Socotra? Why and how do these trees grow there?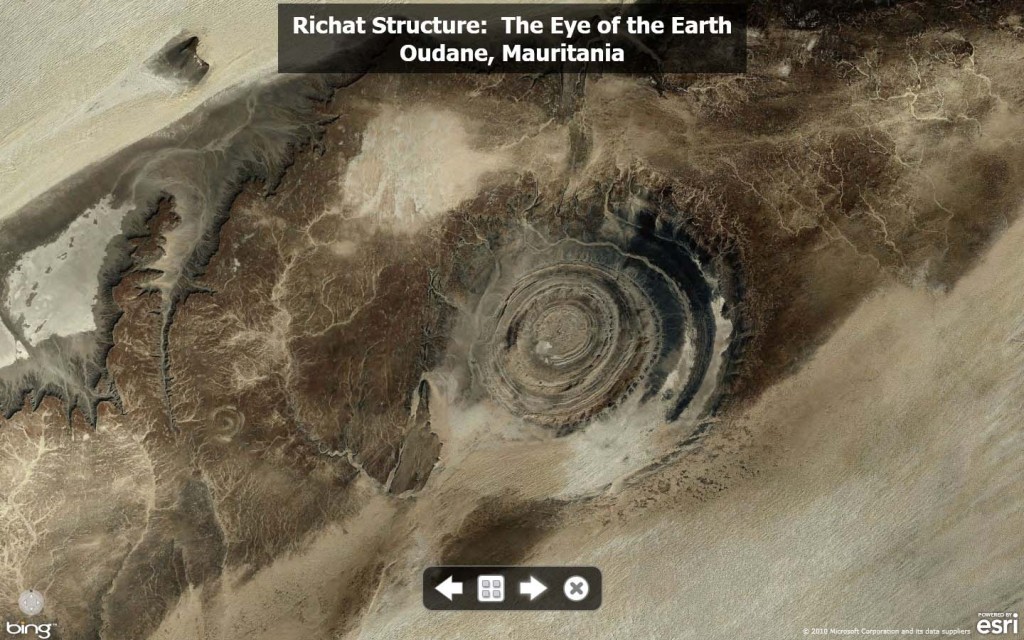
Where is the Richat Structure? Why are its origins still a bit mysterious?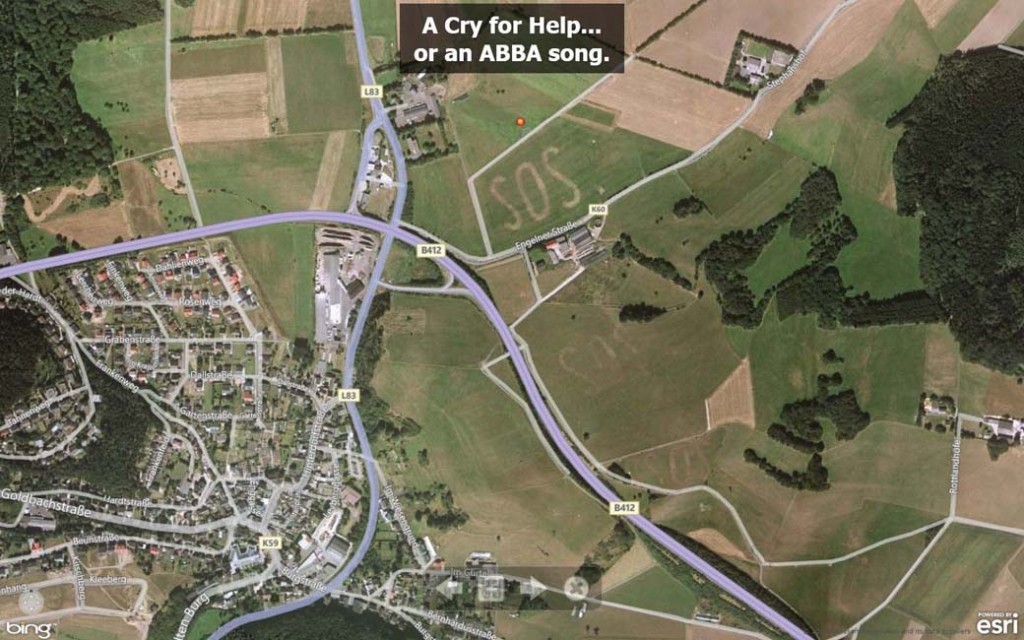
Why do people create drawings on the landscape that can only be fully appreciated from above? What do you notice about the language of the text, the street names, and the landscape that give clues about the location of this image?
Examining the Earth with imagery can be a powerful resource in geography, biology, environmental studies, earth science, and in other courses. Examining imagery can be easily done through the use of ArcGIS Online. The above images are included in an investigation I entitled “Weird Earth.” This investigation includes the images above, as well as a giant lizard, mazes, an erupting volcano, the walled city in the mist, and much more.
Why Weird Earth? First, fascinating patterns, places, and phenomena abound on our planet, and some are just plain weird. Examining the bizarre is an excellent way of sparking student interest. As images are examined, the door for inquiry is opened: What physical and environmental factors caused the land and vegetation to look as it does? What do human-created objects on the landscape say about the culture and language there? What will these images look like tomorrow, in 10 years, in 100 years? Second, I wanted to illustrate that the presentation mode in ArcGIS Explorer Online is an effective and easy-to-use technology to teach such concepts.
View the metadata here. You can also watch the investigation as a video with the introduction here, the investigation here, and the answers and final discussion here.
The presentation is dynamic: You can change the scale and basemaps from satellite images to topographic maps, street maps, and much more, while posing questions, fostering deeper inquiry into places and the processes at work behind those places. For example, when you engage students in examining Socotra using the above slide, zoom in to examine hills versus valleys and the amount of tree cover on each. Zoom out until someone recognizes the island’s location. Then discuss the effect of isolation, latitude, and altitude on the vegetative cover, and why 1/3 of the species are endemic to the Socotra Islands. Change the basemap to topographic to determine the height of the mountains and the depth of the valleys. You can add ecoregions and climate map layers and discuss how these influence the bizarre trees and other species on the island. You can add a population layer and discuss the settlement pattern of the island. Thus, these are by no means static slides. Even calling them “slides” is really a misnomer.
Even better, create your own investigations focused on other processes, specific themes, specific regions, or your own community. What do you consider unique or “weird” about your own community?
How might you use the concept of Weird Earth in your own teaching and learning? How can you use ArcGIS Online to investigate what is strange and interesting about your own community?
- Joseph Kerski, Esri Education Manager

Where is Socotra? Why and how do these trees grow there?

Where is the Richat Structure? Why are its origins still a bit mysterious?

Why do people create drawings on the landscape that can only be fully appreciated from above? What do you notice about the language of the text, the street names, and the landscape that give clues about the location of this image?
Examining the Earth with imagery can be a powerful resource in geography, biology, environmental studies, earth science, and in other courses. Examining imagery can be easily done through the use of ArcGIS Online. The above images are included in an investigation I entitled “Weird Earth.” This investigation includes the images above, as well as a giant lizard, mazes, an erupting volcano, the walled city in the mist, and much more.
Why Weird Earth? First, fascinating patterns, places, and phenomena abound on our planet, and some are just plain weird. Examining the bizarre is an excellent way of sparking student interest. As images are examined, the door for inquiry is opened: What physical and environmental factors caused the land and vegetation to look as it does? What do human-created objects on the landscape say about the culture and language there? What will these images look like tomorrow, in 10 years, in 100 years? Second, I wanted to illustrate that the presentation mode in ArcGIS Explorer Online is an effective and easy-to-use technology to teach such concepts.
View the metadata here. You can also watch the investigation as a video with the introduction here, the investigation here, and the answers and final discussion here.
The presentation is dynamic: You can change the scale and basemaps from satellite images to topographic maps, street maps, and much more, while posing questions, fostering deeper inquiry into places and the processes at work behind those places. For example, when you engage students in examining Socotra using the above slide, zoom in to examine hills versus valleys and the amount of tree cover on each. Zoom out until someone recognizes the island’s location. Then discuss the effect of isolation, latitude, and altitude on the vegetative cover, and why 1/3 of the species are endemic to the Socotra Islands. Change the basemap to topographic to determine the height of the mountains and the depth of the valleys. You can add ecoregions and climate map layers and discuss how these influence the bizarre trees and other species on the island. You can add a population layer and discuss the settlement pattern of the island. Thus, these are by no means static slides. Even calling them “slides” is really a misnomer.
Even better, create your own investigations focused on other processes, specific themes, specific regions, or your own community. What do you consider unique or “weird” about your own community?
How might you use the concept of Weird Earth in your own teaching and learning? How can you use ArcGIS Online to investigate what is strange and interesting about your own community?
- Joseph Kerski, Esri Education Manager
You must be a registered user to add a comment. If you've already registered, sign in. Otherwise, register and sign in.
About the Author
I believe that spatial thinking can transform education and society through the application of Geographic Information Systems for instruction, research, administration, and policy.
I hold 3 degrees in Geography, have served at NOAA, the US Census Bureau, and USGS as a cartographer and geographer, and teach a variety of F2F (Face to Face) (including T3G) and online courses. I have authored a variety of books and textbooks about the environment, STEM, GIS, and education. These include "Interpreting Our World", "Essentials of the Environment", "Tribal GIS", "The GIS Guide to Public Domain Data", "International Perspectives on Teaching and Learning with GIS In Secondary Education", "Spatial Mathematics" and others. I write for 2 blogs, 2 monthly podcasts, and a variety of journals, and have created over 6,500 videos on my Our Earth YouTube channel.
Yet, as time passes, the more I realize my own limitations and that this is a lifelong learning endeavor: Thus I actively seek mentors and collaborators.
Labels
-
Administration
86 -
Announcements
87 -
Career & Tech Ed
1 -
Curriculum-Learning Resources
278 -
Education Facilities
24 -
Events
77 -
GeoInquiries
1 -
Higher Education
612 -
Informal Education
284 -
Licensing Best Practices
99 -
National Geographic MapMaker
39 -
Pedagogy and Education Theory
238 -
Schools (K - 12)
282 -
Schools (K-12)
301 -
Spatial data
39 -
STEM
3 -
Students - Higher Education
255 -
Students - K-12 Schools
141 -
Success Stories
44 -
TeacherDesk
1 -
Tech Tips
129
- « Previous
- Next »