- Home
- :
- All Communities
- :
- Industries
- :
- Education
- :
- Education Blog
- :
- Using the Degree Confluence Project and ArcGIS Onl...
Using the Degree Confluence Project and ArcGIS Online to study regions
- Subscribe to RSS Feed
- Mark as New
- Mark as Read
- Bookmark
- Subscribe
- Printer Friendly Page
Some educators I know use Google Street View images to verify student hypotheses of what the land in each ecoregion would look like. This is a valuable activity. But, the limitation is that Google Street View images do not exist everywhere on the planet, and where it does exist, it is constrained largely to streets and a few trails and not the areas away from human habitation. But what if there was a regular sampling of points across the planet, from which you could see what it looks like from each point? Such a project does exist, called the Degree Confluence Project. This project is crowdsourced, created by a citizen science set of volunteers who set out to photograph all of the full-degree latitude and longitude intersections on land (and in oceans just offshore of land) in the world. In other words, where 30 Degrees South and 140 degrees east longitude cross in Australia or where 43 North latitude and 25 degrees East Longitude cross in Bulgaria.
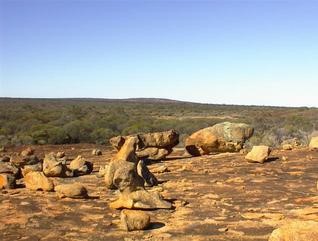
Above, the landscape as it appears at 30 South Latitude, 118 East Longitude, in Western Australia.
Begin degree-by-degree exploration by examining latitude and longitude lines.
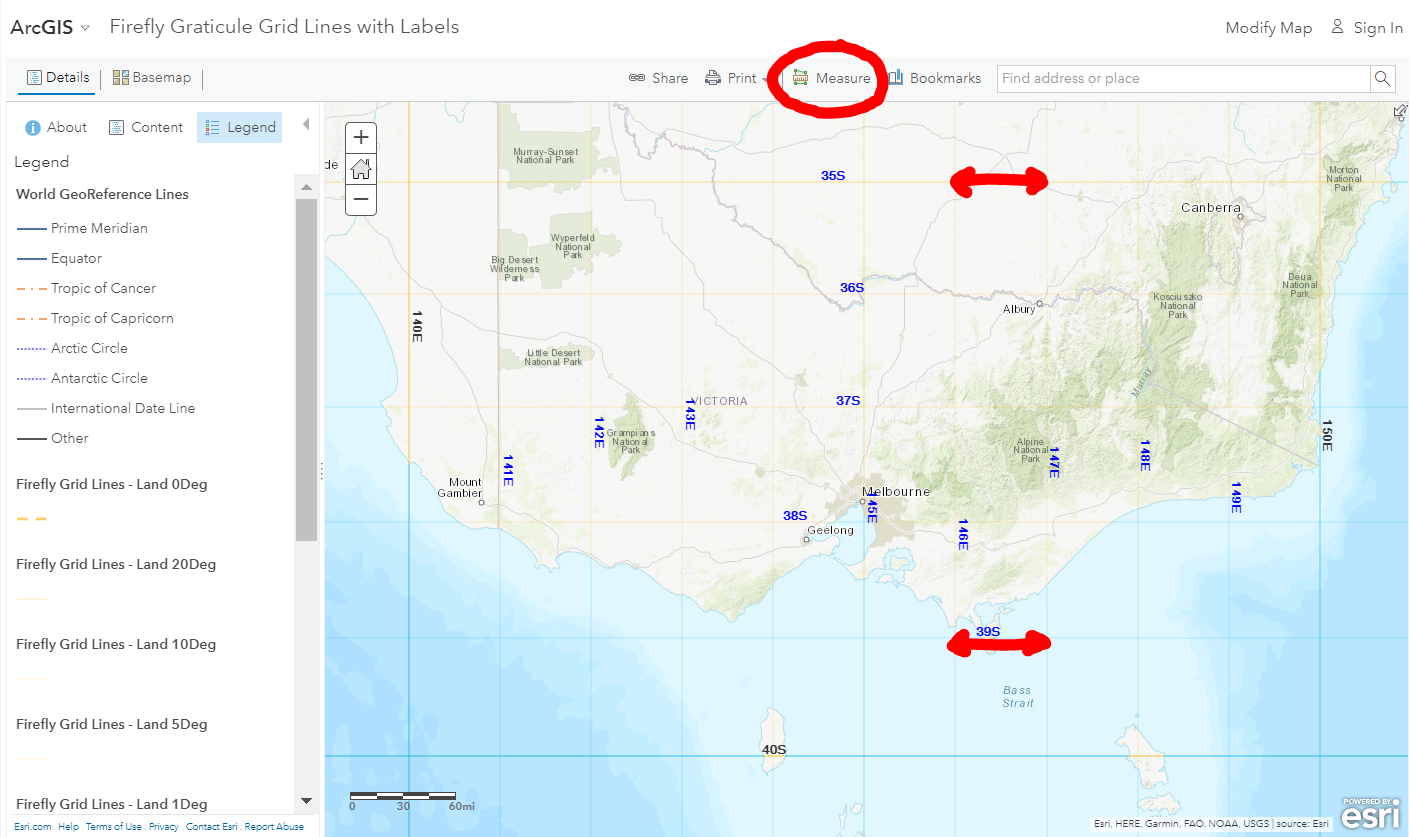
Discuss with your students how the shape of the Earth, as an oblate spheroid, affects the spacing of the one-degree grid. You can use the Add button in any ArcGIS map you are working in to search for graticule and select the 1-degree grid from maps.com_carto, or simply open the following map that contains the Equator, tropics, Prime Meridian, and other lines, as well as the 30, 20, 15, 10, 5, and 1 degree latitude and longitude lines for the world (called “the graticule”), here:
http://www.arcgis.com/home/webmap/viewer.html?webmap=0e6eb80d7a9849cf948c57828b7a85be
Use Bookmarks to zoom to Australia (or another place of interest to you). Zoom in further to Victoria or another state. Use the measure tool to measure the length of 1 degree of latitude at selected locations. It should be the same no matter where you measure, at around 111 km. Then, measure the distance between each degree of longitude. As you move south, the distance should be less as you approach the South Pole. For example, the distance between 145 East and 146 East along 40 South Latitude is around 87 km, but between 145 East and 146 East is around 92 km as measured along 36 South. Again, map projections matter! The distances look the same, but they are not. In fact, observe the size of the 1 degree-by-1-degree rectangles as you pan from south to north across Australia. They should approach being squares as you move toward the Equator, and are longer and longer rectangles as you move south toward the South Pole.
Use the Degree Confluence Project site to examine the Earth’s regions.
Use the Degree Confluence Project in a similar way as I described how Google Street View images are used: Use map resources in conjunction with photographs. For example, use the photographs to verify student hypotheses about what they think that the following biomes will look like: The chaparral biome in southern California USA, polar regions in Nunavut, tropical rainforests in Costa Rica, or grasslands in the USA. You could also use a sample set of images from the site, and ask students to guess, based on image clues, in which biome or country the images were taken.
Navigate the project’s website by country or by compass rose: You can start at the east coast of Australia, for example, at 30 South 153 East, and navigate to the west along 30 degrees south latitude by one degree of longitude per stop, all the way to 115 East. Along the way, ask students: What changes do you detect to the landforms, land use, climate, human impact, water, housing type, and in sky condition, as you move across the country? Which are the primary forces—water, humans, natural hazards, something else—acting on the landscape? Would you say this area is changing more rapidly or more slowly than your own community? What will this landscape look like in 5, 10, or 50 years’ time?
You could repeat this process from north to south or choose another line of latitude or longitude. You could also use the “antipode” function under the compass rose to find out what is on the opposite side of the Earth.
Teaching Notes about Degree Confluences, and Digging Deeper. Ask students to be geographic detectives and determine the time of day and season of the year that the images were taken. Some points have been visited more than once. Ask students to identify at least two changes that have taken place between selected visits to the same location.
Besides the site’s regular sampling of the Earth’s surface, two additional advantages exist with using this site versus random mining for images from Google, Flickr, or another source: (1) This project is focused on documenting the landscape, so the images are primarily about the land, taken in the four cardinal directions from the point and sometimes in additional directions as well; (2) The images are all vetted, curated, and protected; nothing objectionable exists in these photographs (unlike what you could find in a general Google search).
If you want to dig still deeper, an additional crowdsourced set of “street view” images is from Mapillary, and you could also use this tool to take your own images-tied-to-maps.
You must be a registered user to add a comment. If you've already registered, sign in. Otherwise, register and sign in.
-
Administration
89 -
Announcements
86 -
Career & Tech Ed
1 -
Curriculum-Learning Resources
284 -
Education Facilities
24 -
Events
77 -
GeoInquiries
1 -
Higher Education
618 -
Informal Education
285 -
Licensing Best Practices
102 -
National Geographic MapMaker
41 -
Pedagogy and Education Theory
241 -
Schools (K - 12)
282 -
Schools (K-12)
306 -
Spatial data
39 -
STEM
3 -
Students - Higher Education
258 -
Students - K-12 Schools
145 -
Success Stories
44 -
TeacherDesk
1 -
Tech Tips
127
- « Previous
- Next »