- Home
- :
- All Communities
- :
- Industries
- :
- Education
- :
- Education Blog
- :
- Using Esri Policy Maps in Education
Using Esri Policy Maps in Education
- Subscribe to RSS Feed
- Mark as New
- Mark as Read
- Bookmark
- Subscribe
- Printer Friendly Page
Despite the changes in GIS technology and applications over the past 50 years, one thing has remained constant: GIS is relevant. Esri Maps for Public Policy is a growing collection of maps and other content spanning many relevant issues of our time, including social equity, health, economic opportunity, resilience, sustainability, environment and natural resources, and public safety. A "policy map" can be thought of as any map that can be used in shaping or forming public policy, from the community to the national or international level. Esri provides these resources to raise the level of spatial and data literacy that is used in public policy, and to encourage people to get involved. Visit Esri Maps for Public Policy to explore curated content, training, best practices, and datasets that can provide a baseline for your research, analysis, and policy recommendations.
At this site, you can build your own collection of interactive web maps, focused on the topics and the area of your interest. The default set at this time includes 11 maps, ranging from unemployment, daytime population, social vulnerability index, working seniors, the uninsured, travel restrictions, and COVID-19 cases. You can save and share the default set or your own set. My colleague, for example, created this collection of 5 maps about youth in the Los Angeles area in this interactive set, shown below.
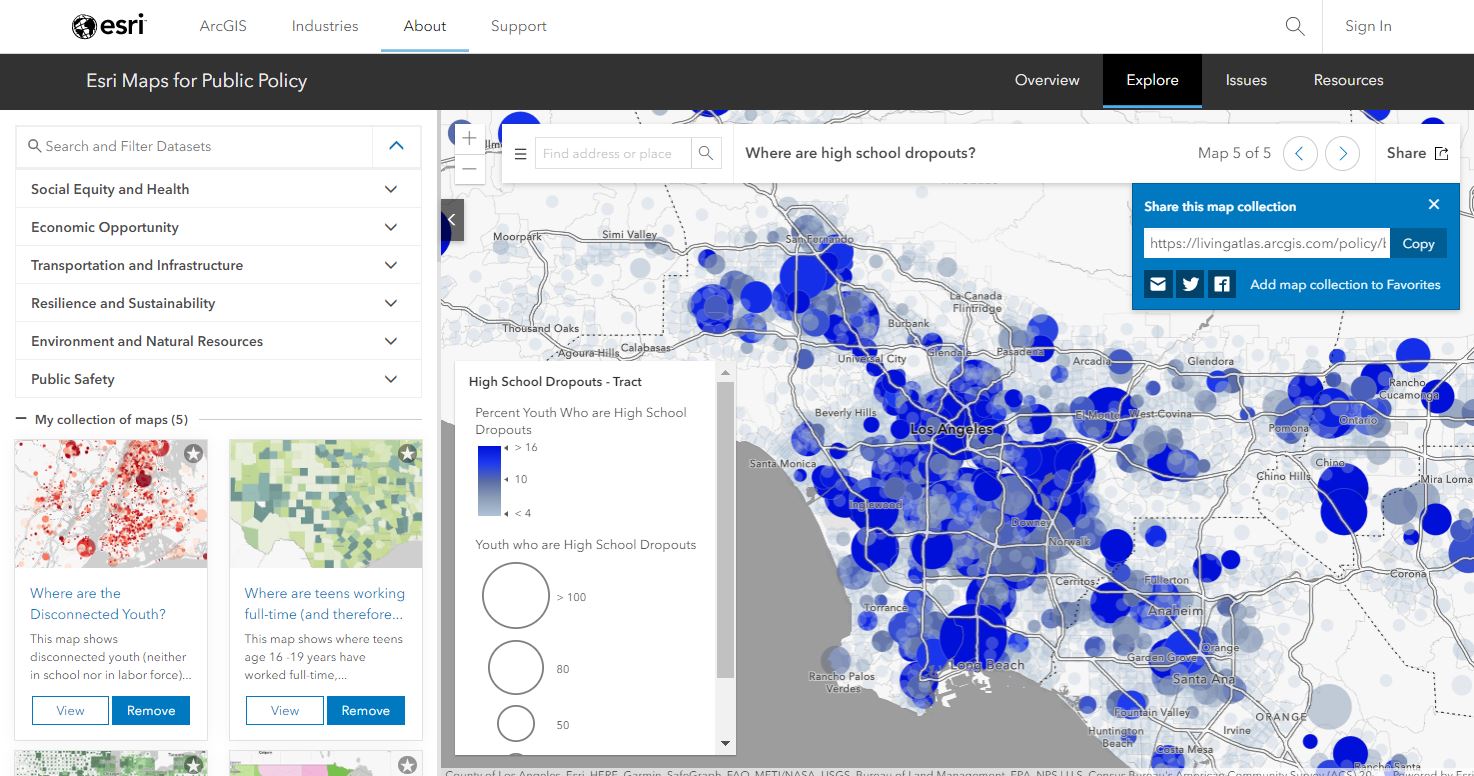
Example set of policy maps.
Another way of accessing policy-related maps from the ArcGIS Living Atlas of the World is in this collection.
Let's say you were a faculty member or student 20 years ago. You could do some of this work if you knew where to look for the data, how to process it, how to map it, how to analyze it, and how to share it. And, if you had time to work through all of these steps. With the advent of ArcGIS as a platform, so many more possibilities emerge, of which, PolicyMaps is one powerful example: Allowing mapping and analysis to be much more rapidly done with a wide variety of data, in one place.
The "Explore" tab allows the user to browse through categories such as transportation, environment, and other themes, with an intuitive interface based on ArcGIS Online. The "Issues" tab allows for deeper dives into many of the central topics of concern in our times, such as affordable housing, race inequity, and opioid addiction. The resources under each issue include a variety of mapped content, including feature layers, web maps, story maps, tabular data, dashboards, and ArcGIS Hubs.
The "Resources" tab helps you learn how to build maps, how to add your map collections to a story map, and how to embed your maps in web pages. Two of my favorite resources are this video highlighting 10 tips for creating effective policy story maps, and this Learn Path that walks you through an introduction to policy mapping with 7 readings and activities.
Why should you consider using policy maps as an educational resource? First, students using these maps gain skills in using a web GIS system, in this case, the ArcGIS platform, as they create collections, change classification methods, symbology, analyze different variables, and save and share their results. Second, as they change variables, issues, and scales, they are gaining skills in spatial thinking, considering spatial and temporal patterns, relationships, and trends. Third, the maps are well documented with metadata, and examining the data encourages your students to adopt sound metadata practices in their own work. Fourth, policy maps can make an abstract or confusing issue easier to understand by putting it in the context of places that students know, and thus can relate it to their own experiences.
Another advantage of using policy maps is that they begin with a workable small sample of maps, out of the thousands of layers that exist in the ArcGIS Living Atlas of the World. Policy maps also can help students understand at least part of a complex issue with just one map. For example, COVID-19 data can be accessed via a large number of maps, dashboards, and infographics, as people have been doing for several months now, by the millions. But this policy map distills the data from the live feeds into 5 categories from emergent to end stage. More data is not always better.
However, if and when your students do need to access additional variables and map layers, these resources are at their fingertips in ArcGIS Online, other data portals, and the Living Atlas of the World. Students can also gather their own data, via spreadsheets, field surveys, and other means.
Beyond fostering skills in spatial thinking and geotechnologies, engaging with these maps encourages students to do their own research--a central aim of education. The research is not limited to the data on the maps, of course, but the maps help spark the initial curiosity. Students will also see examples of presenting the results of research via story maps, other web mapping applications, and videos, and use those resources as guidance as they prepare to give their own written or oral presentations.
Engaging with these maps also fosters ties to the geographic inquiry process, where your students ask a geographic question, gather data, analyze that data, communicate the results of the analysis, and act on what is learned. Many of these policy maps illustrate, in my view, where an opportunity exists to take action. Thus, using them empowers your students to tackle issues they care deeply about. Is it litter, pedestrian-friendliness, invasive species, water quality, economic inequality, or something else?
I encourage you to explore these policy maps, and I look forward to reading your comments below.
You must be a registered user to add a comment. If you've already registered, sign in. Otherwise, register and sign in.
-
Administration
90 -
Announcements
88 -
Career & Tech Ed
1 -
Curriculum-Learning Resources
288 -
Education Facilities
24 -
Events
78 -
GeoInquiries
1 -
Higher Education
620 -
Informal Education
286 -
Licensing Best Practices
102 -
National Geographic MapMaker
44 -
Pedagogy and Education Theory
243 -
Schools (K - 12)
282 -
Schools (K-12)
311 -
Spatial data
40 -
STEM
3 -
Students - Higher Education
261 -
Students - K-12 Schools
149 -
Success Stories
45 -
TeacherDesk
1 -
Tech Tips
130
- « Previous
- Next »