- Home
- :
- All Communities
- :
- Industries
- :
- Education
- :
- Education Blog
- :
- Updating and Curating Maps, Data, and Lessons
Updating and Curating Maps, Data, and Lessons
- Subscribe to RSS Feed
- Mark as New
- Mark as Read
- Bookmark
- Subscribe
- Printer Friendly Page
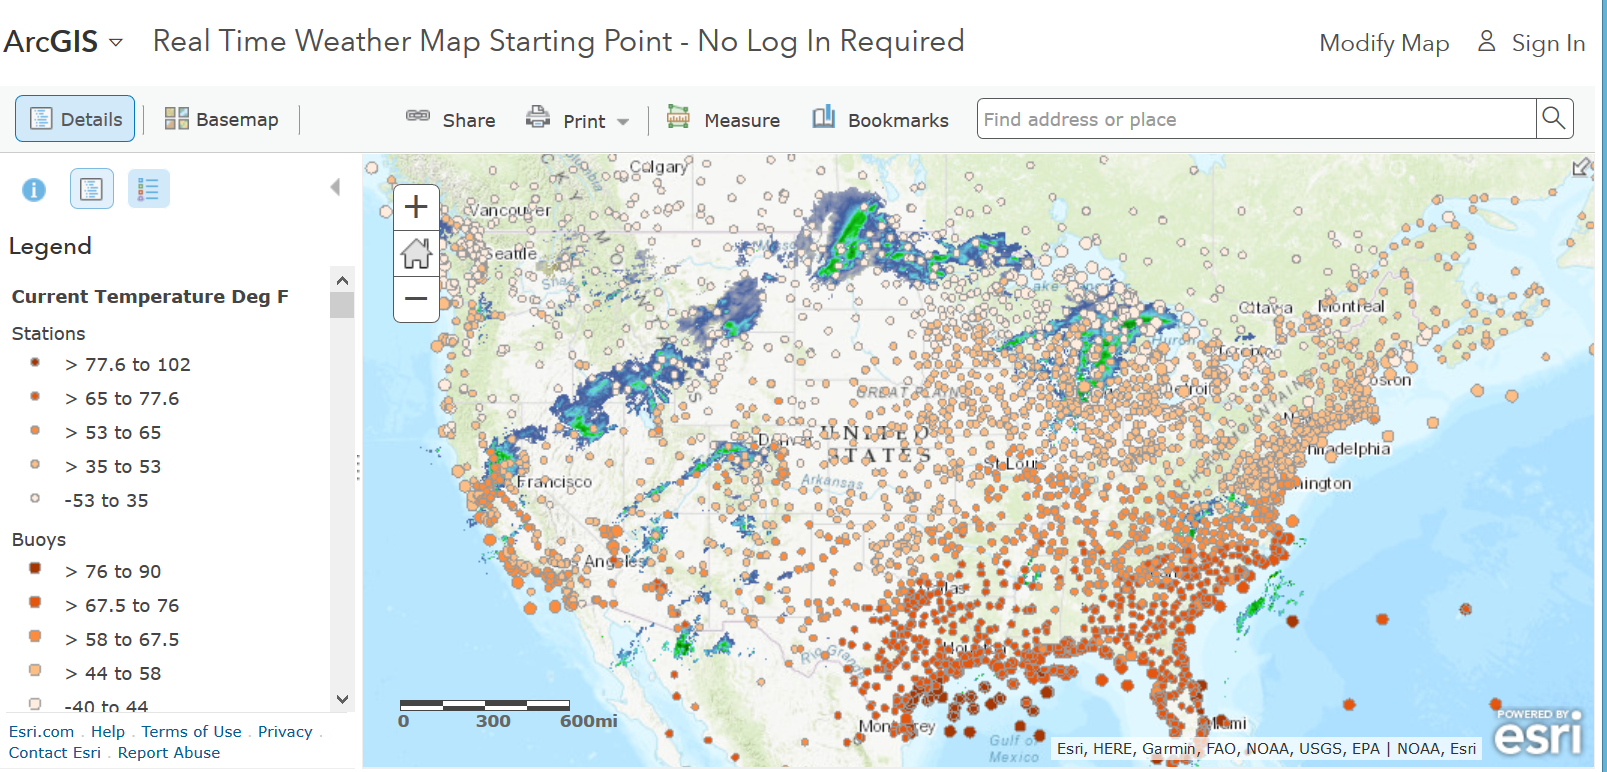
Curation of spatial data is an important topic for anyone working in GIS, particularly with the advent of web GIS. In this dynamic environment, services behind the layers in any online map could change, rendering components of that map unusable. Yes, even your maps and mine. Let’s make an example of a weather map tied to a lesson that I created and frequently use.
This lesson asks students to analyze the patterns of wind speed, wind direction, pressure, and temperature, for the USA and for the world, asking them to consider latitude, altitude, proximity to coastlines, prevailing winds, high and low pressure zones, and stream gauging stations. The lesson asks students to make weather predictions in specific cities and to interpolate surfaces (by state, to keep the lesson manageable) of temperature, pressure, and wind speed based on point data. I love this data set and lesson because they (1) require hands-on inquiry and investigation; (2) connect geography, meteorology, climatology, mathematics, physics, GIS, and change over space and time; (3) use real time data that are interesting and that students can tie to their own local observations; (4) use weather data that is global in nature. Admittedly, some countries have relatively few weather observations in the data set, but even that fact that be turned into a teachable moment (“can we trust an interpolated surface from only 2 observations in that country?”).
Several educators alerted me recently to the fact that the weather layer containing current wind speed, wind direction, temperature, pressure, and other variables was no longer working in my map. How did these educators know it was my layer and how to contact me? Well, I maintain metadata for my maps and layers in ArcGIS Online, and also a profile for each of my ArcGIS Online accounts, so that data users know how to contact me. I encourage you to do the same—populate metadata for your maps and maintain a profile in ArcGIS Online. Besides being a good steward and serving the community with the metadata that you provide, doing this can also save you time in data curation, and can even be a lifesaver. While this doesn’t excuse you from periodically checking your maps and layers to make sure they are working properly, I suspect that many of us have a large number maps and layers online and a lack of staff we can delegate data curation tasks to. The resulting reality is that sometimes some of our content is not working as it should. Therefore, I really appreciated that these data users notified me!
In short, in my Feature Layer item: http://www.arcgis.com/home/item.html?id=89dca88ea1d34c4d8ded02ca21e540d5 was a reference to ‘tmservices1.esri.com’, which I needed to replace with ‘livefeeds.arcgis.com’. It had the same service directory and name; just the server had changed.
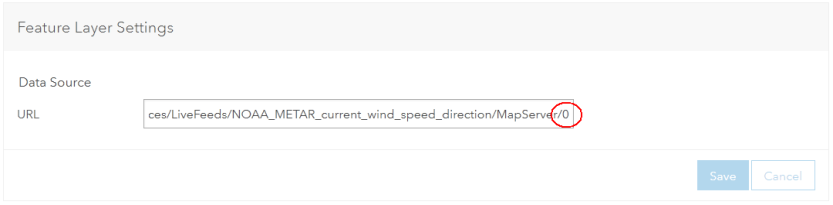
To update my map, I needed to point to the updated location of the layer. I could have done this either by re-creating my web map from scratch, and pointing to the new location, or by accessing my layer’s data service, using the AGOL Assistant by using the “Update the URLs of Services in a Web Map” as shown below.

Here is URL of one of my services: https://livefeeds.arcgis.com/arcgis/rest/services/LiveFeeds/NOAA_METAR_current_wind_speed_direction/...
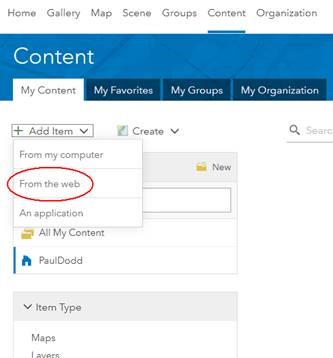
Another thing I needed to address now that the service had changed was as follows: Using the livefeeds server requires the user to have an account in ArcGIS Online. This new situation means that the users of my map now need to log in to ArcGIS Online to use it. But let’s say I want to provide an option for anyone to open the map, even if they do not have an ArcGIS Online account. That way, anyone could complete the first part of the lesson, before the steps requiring the analysis tools. Once the analysis steps are reached, everyone needs to be logged in.
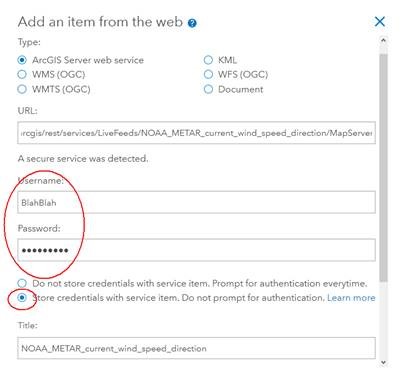
To allow users to use the map without logging in, I created a “Stored Credential” item for this layer or service under my account and then I added the resulting item to the map. In my case, the Live Feed Services require subscription access, but will not consume credits. Creating the stored credential allows anyone to access my layer by using my own ArcGIS Online credentials. Once done, I added the layer to my map, shared it publicly, and now, anyone can open my web map in ArcGIS Online without being asked to log in.
I decided to create two identical maps, one for the educator and student who just wants to work through the front half of my lesson, that did not require a log in, and one for those who want to complete the entire lesson. Once I created these two maps, I rewrote the front part of my lesson as follows:
Open and save map. Open either of the following maps that use ArcGIS Online:
- http://arcg.is/1qXXjH This is the Real Time Weather Map Starting Point that requires you to be logged in to ArcGIS Online, because it is accessing data in the Living Atlas of the World. Use this map if you wish to run through this entire exercise, including the analysis steps. After you log in, save this map in your own ArcGIS Online account’s workspace. As you work through the steps below in this exercise, save your map after each step.
- http://arcg.is/Oir1j This is the Real Time Weather Map Starting Point that does not require a log in. Use this map if you are simply doing a visual inspection of the patterns that you see on the map. You can change the style, filter the data, and perform other tasks, but you will not be able to complete the interpolation portion of this exercise with this map and without logging in to ArcGIS Online.
For further investigation about storing credentials for map services, read the documentation here. If you are interested in more weather data, see the layers supporting the USA Weather Warnings and Watches Live Feed Service, which are maintained automatically. These layers contain even more information than the layers tied to the map that I use in my lesson, including Public Forecast Zones, Fire Forecast Zones, and Coastal/Offshore Marine Zones as well as current Warnings and Watches.
You must be a registered user to add a comment. If you've already registered, sign in. Otherwise, register and sign in.
-
Administration
89 -
Announcements
86 -
Career & Tech Ed
1 -
Curriculum-Learning Resources
284 -
Education Facilities
24 -
Events
77 -
GeoInquiries
1 -
Higher Education
618 -
Informal Education
285 -
Licensing Best Practices
102 -
National Geographic MapMaker
41 -
Pedagogy and Education Theory
240 -
Schools (K - 12)
282 -
Schools (K-12)
305 -
Spatial data
39 -
STEM
3 -
Students - Higher Education
258 -
Students - K-12 Schools
144 -
Success Stories
44 -
TeacherDesk
1 -
Tech Tips
127
- « Previous
- Next »