Turn on suggestions
Auto-suggest helps you quickly narrow down your search results by suggesting possible matches as you type.
Cancel
- Home
- :
- All Communities
- :
- Industries
- :
- Education
- :
- Education Blog
- :
- Teaching Spatial Concepts with Zonal Statistics
Teaching Spatial Concepts with Zonal Statistics
Subscribe
920
0
06-27-2013 10:15 PM
- Subscribe to RSS Feed
- Mark as New
- Mark as Read
- Bookmark
- Subscribe
- Printer Friendly Page
06-27-2013
10:15 PM
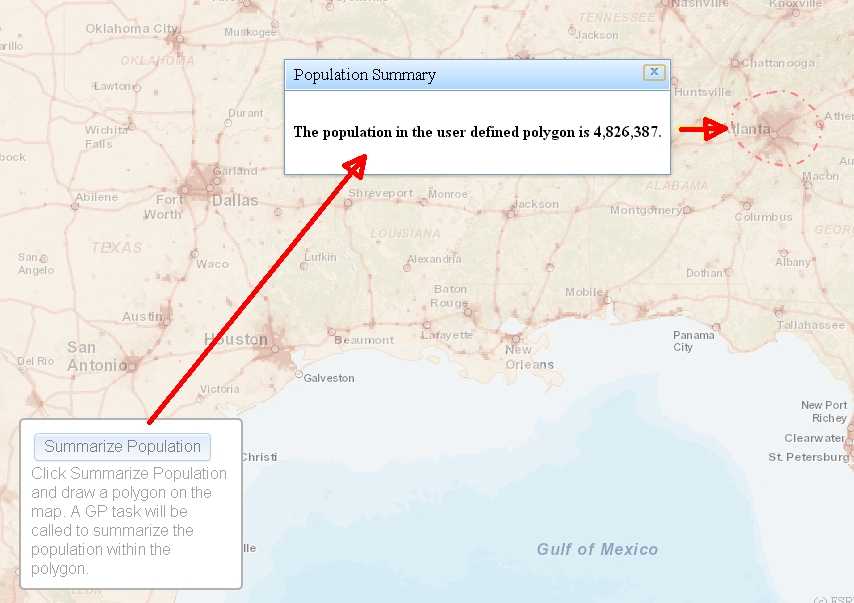
I recently created a set of activities based on using web-based GIS tools to teaching spatial thinking using drive-time..., and another set of activities that use viewsheds. Another type of spatial analysis computes and summarizes data from points, lines, or polygons, and is called “zonal statistics.” To easily use an application of zonal statistics, use this map to summarize population in specific areas.
After accessing the map, click "Summarize Population" in the lower left section of the map and then draw a polygon that encompasses Atlanta, Georgia.
What is the population of the Atlanta area? Why is your result likely to be different each time you draw the polygon? How does the population of an area of similar size in rural Georgia compare to the population of Atlanta? How does the population of an area of similar size in rural Wyoming compare to rural Georgia? Compare your counts to areas of similar sizes in the Ganges River basin in India, or to an area in the Sahara Desert. Why is the base data that is being used for the population counts critical to the specific results you receive from these calculations? Test the results over the ocean: Do the counts total zero?
How might you be able to use this tool in teaching and learning about issues of map projections, data quality, zonal statistics, and other spatial concepts?

Calculating the population of the Atlanta area with zonal statistics tool.
After accessing the map, click "Summarize Population" in the lower left section of the map and then draw a polygon that encompasses Atlanta, Georgia.
What is the population of the Atlanta area? Why is your result likely to be different each time you draw the polygon? How does the population of an area of similar size in rural Georgia compare to the population of Atlanta? How does the population of an area of similar size in rural Wyoming compare to rural Georgia? Compare your counts to areas of similar sizes in the Ganges River basin in India, or to an area in the Sahara Desert. Why is the base data that is being used for the population counts critical to the specific results you receive from these calculations? Test the results over the ocean: Do the counts total zero?
How might you be able to use this tool in teaching and learning about issues of map projections, data quality, zonal statistics, and other spatial concepts?
You must be a registered user to add a comment. If you've already registered, sign in. Otherwise, register and sign in.
About the Author
I believe that spatial thinking can transform education and society through the application of Geographic Information Systems for instruction, research, administration, and policy.
I hold 3 degrees in Geography, have served at NOAA, the US Census Bureau, and USGS as a cartographer and geographer, and teach a variety of F2F (Face to Face) (including T3G) and online courses. I have authored a variety of books and textbooks about the environment, STEM, GIS, and education. These include "Interpreting Our World", "Essentials of the Environment", "Tribal GIS", "The GIS Guide to Public Domain Data", "International Perspectives on Teaching and Learning with GIS In Secondary Education", "Spatial Mathematics" and others. I write for 2 blogs, 2 monthly podcasts, and a variety of journals, and have created over 6,500 videos on my Our Earth YouTube channel.
Yet, as time passes, the more I realize my own limitations and that this is a lifelong learning endeavor: Thus I actively seek mentors and collaborators.
Labels
-
Administration
90 -
Announcements
88 -
Career & Tech Ed
1 -
Curriculum-Learning Resources
289 -
Education Facilities
24 -
Events
78 -
GeoInquiries
1 -
Higher Education
620 -
Informal Education
286 -
Licensing Best Practices
102 -
National Geographic MapMaker
44 -
Pedagogy and Education Theory
244 -
Schools (K - 12)
282 -
Schools (K-12)
312 -
Spatial data
40 -
STEM
3 -
Students - Higher Education
261 -
Students - K-12 Schools
149 -
Success Stories
45 -
TeacherDesk
1 -
Tech Tips
130
- « Previous
- Next »