Turn on suggestions
Auto-suggest helps you quickly narrow down your search results by suggesting possible matches as you type.
Cancel
- Home
- :
- All Communities
- :
- Industries
- :
- Education
- :
- Education Blog
- :
- Teaching Spatial Concepts with Drive-Time Buffers
Teaching Spatial Concepts with Drive-Time Buffers
Subscribe
1294
0
06-13-2013 11:00 PM
- Subscribe to RSS Feed
- Mark as New
- Mark as Read
- Bookmark
- Subscribe
- Printer Friendly Page
06-13-2013
11:00 PM
Teaching spatial concepts and analysis can be effectively done with web-based GIS tools. One type of spatial analysis involves the use of buffers--areas that show proximity to mapped features. One kind of buffer is a “drive time” or “service area” buffer, which can be used to calculate and display the amount of time required to walk, bicycle, or drive to or from a certain location. This developer map is also useful for teaching to create some buffers, in this case, drive time.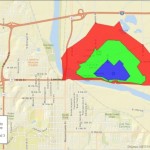
Click on a location in the city of Lawrence, Kansas and wait a moment for the drive time buffer to appear. Ask the students: Why aren't these buffers a perfect circle? Click on Interstate Highway 70 and note the differences between the buffer along this limited access highway versus a buffer along city streets. Click on a point just north of the river and note the effect of the river that blocks quick access to areas south of it.
These drive time buffers depend not only on the street location and density, but they have intelligence beyond street location: They take into account one-way streets, stop signs and stop lights, traffic volume, speed limit, physical barriers, and terrain. Pan the map to a rural area outside Lawrence and click on the map in that location. What is the difference in the amount of terrain someone could reach in 1, 2, and 3 minutes from a rural area versus that from an urban area? Why do these differences exist? Pan to the location where you live and calculate drive time buffers in different locations in your own community.
For an application of this concept in analyzing access to a specific type of business, access this map showing pizza restaurants that are within a 3 minute drive of the location you selec.... Click on various locations and note the differences in the buffer and the resulting selected restaurants. This service uses a Yahoo! Local Search to calculate its drive time, but also note that terrain is still important. In other words, yes, physical geography still matters!
Both of these live maps and the services they provide are easy to use, fascinating, and can foster much good discussion about the practical application of spatial thinking and analysis.

1-2-3 minute drive time buffers
Click on a location in the city of Lawrence, Kansas and wait a moment for the drive time buffer to appear. Ask the students: Why aren't these buffers a perfect circle? Click on Interstate Highway 70 and note the differences between the buffer along this limited access highway versus a buffer along city streets. Click on a point just north of the river and note the effect of the river that blocks quick access to areas south of it.
These drive time buffers depend not only on the street location and density, but they have intelligence beyond street location: They take into account one-way streets, stop signs and stop lights, traffic volume, speed limit, physical barriers, and terrain. Pan the map to a rural area outside Lawrence and click on the map in that location. What is the difference in the amount of terrain someone could reach in 1, 2, and 3 minutes from a rural area versus that from an urban area? Why do these differences exist? Pan to the location where you live and calculate drive time buffers in different locations in your own community.
For an application of this concept in analyzing access to a specific type of business, access this map showing pizza restaurants that are within a 3 minute drive of the location you selec.... Click on various locations and note the differences in the buffer and the resulting selected restaurants. This service uses a Yahoo! Local Search to calculate its drive time, but also note that terrain is still important. In other words, yes, physical geography still matters!
Both of these live maps and the services they provide are easy to use, fascinating, and can foster much good discussion about the practical application of spatial thinking and analysis.
You must be a registered user to add a comment. If you've already registered, sign in. Otherwise, register and sign in.
About the Author
I believe that spatial thinking can transform education and society through the application of Geographic Information Systems for instruction, research, administration, and policy.
I hold 3 degrees in Geography, have served at NOAA, the US Census Bureau, and USGS as a cartographer and geographer, and teach a variety of F2F (Face to Face) (including T3G) and online courses. I have authored a variety of books and textbooks about the environment, STEM, GIS, and education. These include "Interpreting Our World", "Essentials of the Environment", "Tribal GIS", "The GIS Guide to Public Domain Data", "International Perspectives on Teaching and Learning with GIS In Secondary Education", "Spatial Mathematics" and others. I write for 2 blogs, 2 monthly podcasts, and a variety of journals, and have created over 6,500 videos on my Our Earth YouTube channel.
Yet, as time passes, the more I realize my own limitations and that this is a lifelong learning endeavor: Thus I actively seek mentors and collaborators.
Labels
-
Administration
90 -
Announcements
88 -
Career & Tech Ed
1 -
Curriculum-Learning Resources
288 -
Education Facilities
24 -
Events
78 -
GeoInquiries
1 -
Higher Education
620 -
Informal Education
286 -
Licensing Best Practices
102 -
National Geographic MapMaker
44 -
Pedagogy and Education Theory
243 -
Schools (K - 12)
282 -
Schools (K-12)
311 -
Spatial data
40 -
STEM
3 -
Students - Higher Education
261 -
Students - K-12 Schools
149 -
Success Stories
45 -
TeacherDesk
1 -
Tech Tips
130
- « Previous
- Next »