Teaching Modern Remote Sensing
- Subscribe to RSS Feed
- Mark as New
- Mark as Read
- Bookmark
- Subscribe
- Printer Friendly Page
How should remote sensing be taught in the decade of the 2020s? Remote sensing is more relevant to society and to education than ever before: (1) Remote sensing data sources, from Lidar, UAS, small satellites, and beyond, are rapidly diversifying, providing rich resources from which we may better understand our planet; (2) Remote sensing applications have spread far beyond natural resource management and GIScience to city planning, health, natural hazards, engineering, transportation, and many other fields. Developing remote sensing skills can help students secure careers where they can make a meaningful contribution to their own communities, and far beyond. A combination of GIS and remote sensing skills will continue to be in increasing demand in the workforce. (3) Remote sensing tools are more accessible than ever before: Image analysis, for example, can be done in a web browser through ArcGIS Online and in web mapping applications, and it can also be done in ArcGIS Pro. Remote sensing tools are also increasingly intertwined with GIS tools and workflows through this same ArcGIS platform. GIS and remote sensing are no longer two parallel communities as they were 30 years ago. Additional good news for instructors is that the ArcGIS platform allows you to teach GIS and remote sensing in a single environment.
No matter if you are beginning a new remote sensing course or program, or want to modernize your existing remote sensing curriculum, my view is that that the primary objectives should be: (1) to get students excited about remote sensing so that they will want to make it a key part of their academic and career pathway, (2) to provide interesting, compelling activities that will enable students to begin hands-on investigations right away, (3) to provide students with scientific and geotechnical foundations of remote sensing, and (4) to keep moving students forward to advanced applications.
The following are some ideas for incorporating modern remote sensing tools, data, fundamentals, and activities. This essay provides introductory guidance, while subsequent essays will provide guidance on digging deeper with the tools and data, including textbooks, advanced analytics, and additional resources.
Imagery-based web mapping applications. These applications provide easy-to-use browser-based tools with compelling data, and thus are perfect for introducing foundations and skills. Consider using the following two applications to start: (1) The Landsat Lens allows your students to examine changes from natural and human causes, all over the world. These causes could include volcanism, agriculture, the construction of dams and reservoirs, coastal erosion, glacial retreat, urbanization, mining, the shrinkage of lakes such as Lake Chad and the Aral Sea, evidence of political boundaries and differing land use on either side of specific borders, and many more.
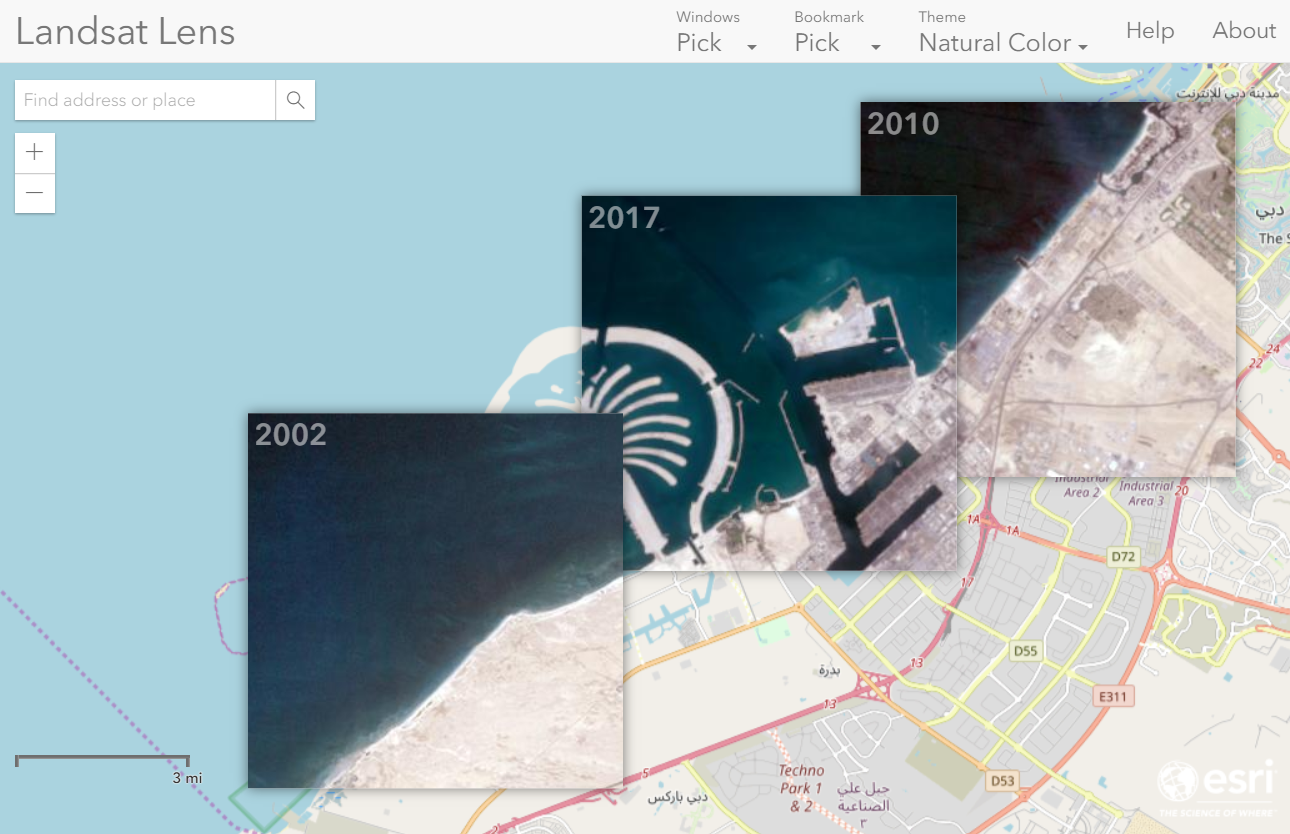
Examining change over space and time with the Landsat Lens.
(2) The Landsat Explorer allows your students to deepen their understanding of changes over space and time, as well as concepts of spectral bands, image resolution, and creating web mapping applications such as swipe maps. Guidance is provided for these techniques, and one of the advantages of the Landsat Lens and the Landsat Explorer is that they run in a standard web browser, with nothing to install or to sign into. But the logical next step is to ask the students to sign into the Landsat Explorer so they can save the layers that they generate, and be able to do further analysis on the images in ArcGIS Online, or in ArcGIS Pro.
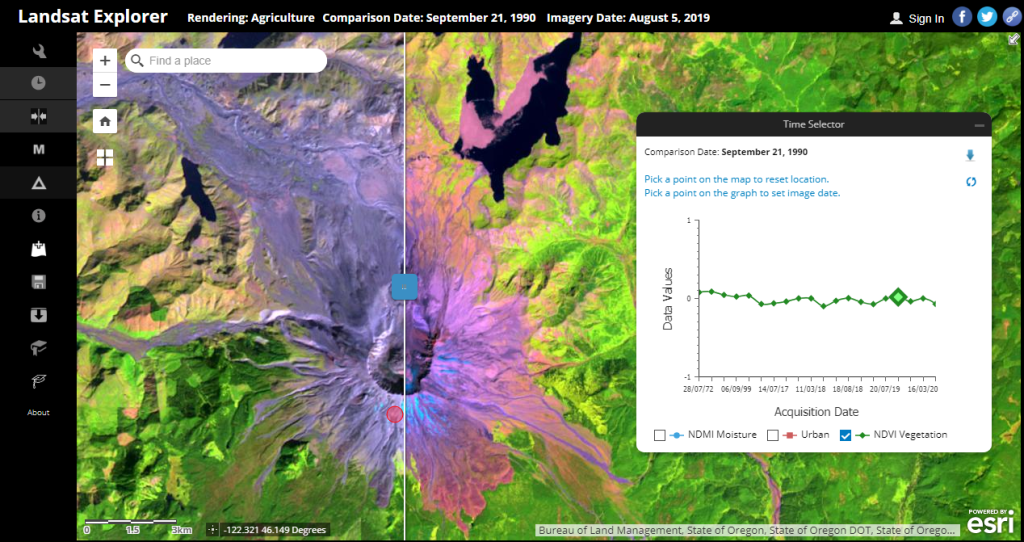
Creating a swipe map with the Landsat Explorer Web App.
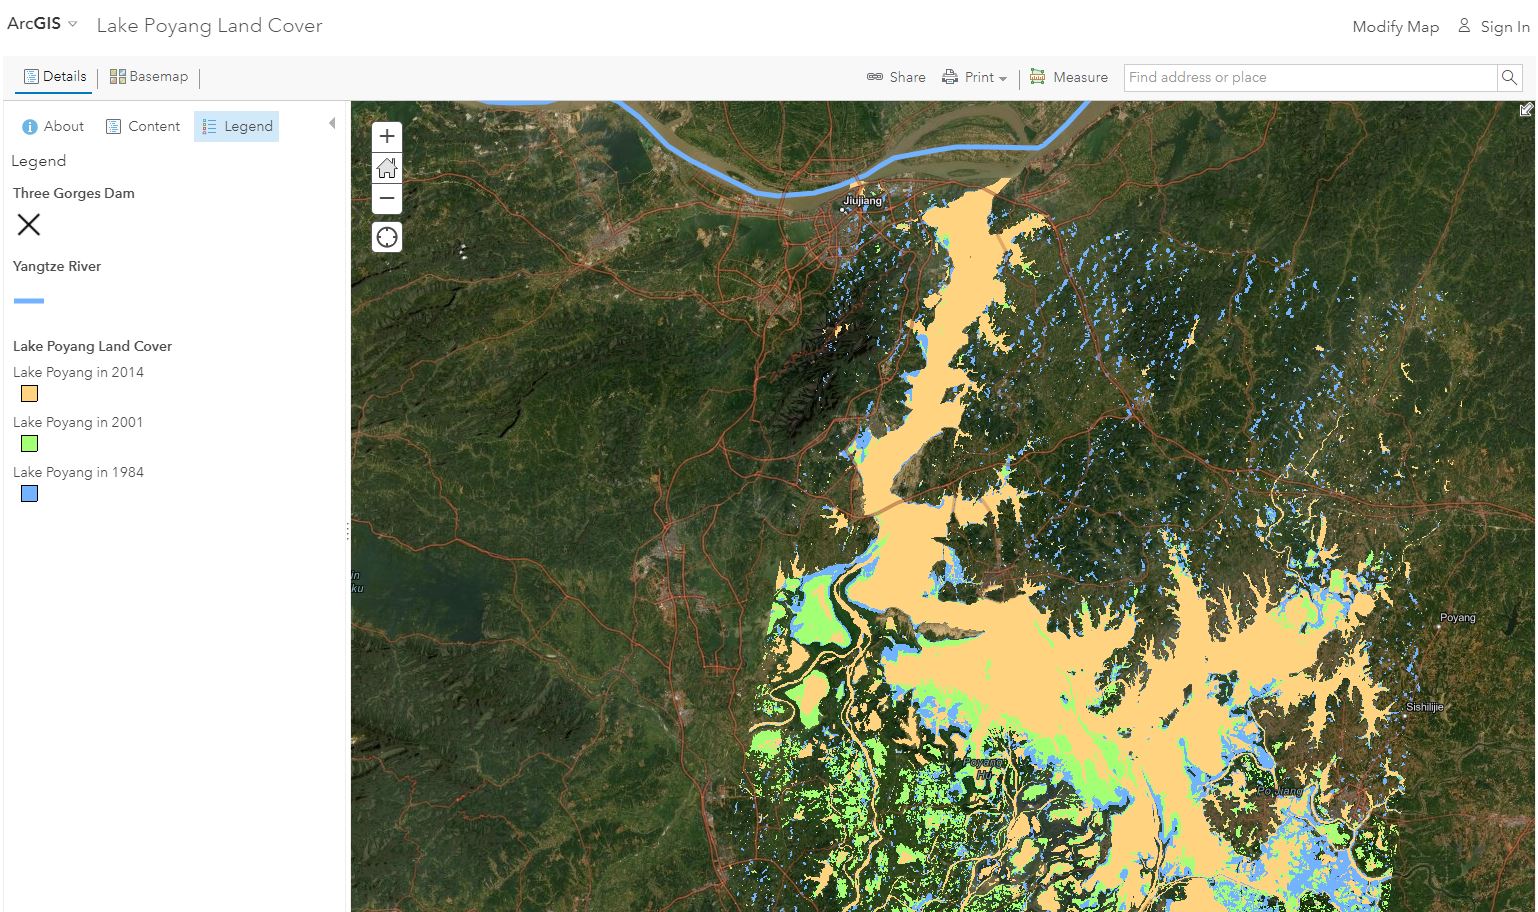
Another popular remote sensing web application containing a vast amount of data is the Wayback image service. You and your students can access 6 years of high resolution satellite imagery (and growing) for the entire planet. Consider the themes you could teach using this resource--urban sprawl, agricultural expansion, deforestation and reforestation, mining and reclamation, the construction of dams, changing water levels in reservoirs due to droughts or heavy precipitation, glacial retreat, meandering river processes, and much more. Discuss differences in the spectral band and resolution between the Wayback images and the Landsat imagery you analyzed earlier. You can even examine changes on your own school or university campus with the detail that is now at your fingertips. Similar to the Landsat Explorer, you can use this application without being signed in to ArcGIS Online, but if you are signed in, you can save specific layers and bring them to ArcGIS Online and ArcGIS Pro for further analysis.
After students have used the above image applications, they should be ready to build one of their own. This lesson guides them in the creation of an application focused on the devastating 2014 Oso, Washington landslide, using Web App Builder. Next, ask them to create a side-by-side 2D and 3D comparison app of any area on the planet that they choose. Here is a sample that I built for one of my favorite areas on the planet--Mt Garfield, Colorado.
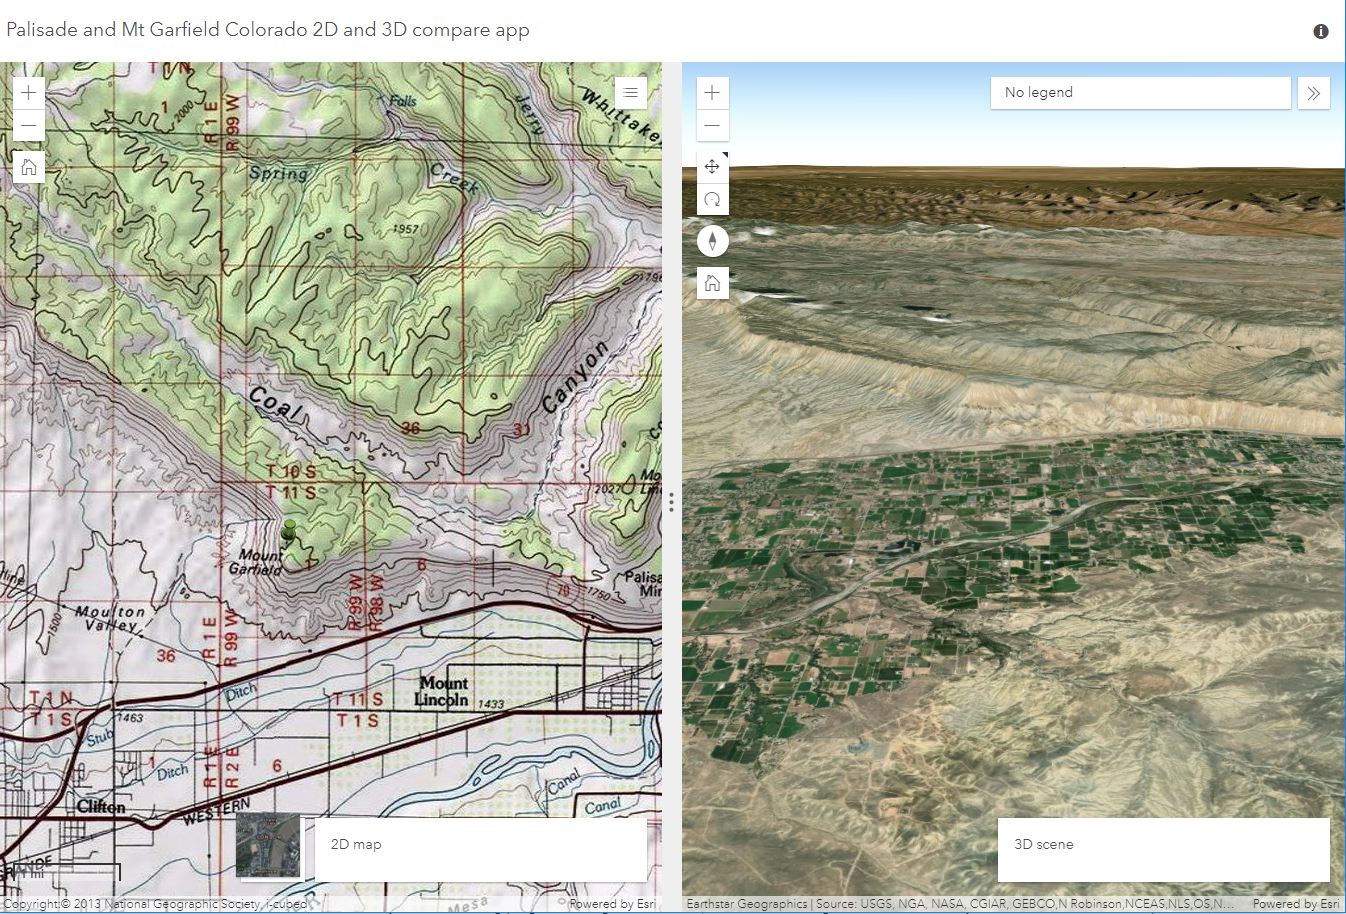
Mt Garfield, Colorado, 2D map and 3D scene.
Next, explore and teach with some of the image data sets available in the ArcGIS Living Atlas of the World. This includes such imagery as Sentinel-2, NAIP, Landsat, Digital Orthophotos, Lidar, and much more. Bring the Sentinel-2 data into ArcGIS Online, filter it by date, and change the rendering to examine such phenomena as eruptions at Kilauea, as I provide guidance on here. I compiled this list of additional Landsat image sites, which may be useful in having students practicing accessing different types of data from a variety of portals.
Selected Activities. Next, work through some hands-on activities, beginning with the above web mapping applications, continuing with ArcGIS Online, and then using ArcGIS Pro. The Esri training site, or "Esri Academy" is one way to start. Begin with an introduction to image classification with this web course, and continue with additional courses in this image classification learning plan. Get started with Drone2Map using this web course, and with this learning plan, you will gain essential skills needed to monitor and analyze real-time data, and understand how to connect to real-time sensors, analyze and visualize a data feed, and send updates and alerts.
The Learn lesson library is another way to get hands-on experience. One of my favorites in this library is the use of NASA GOES real-time weather imagery in conjunction with predicting the weather, using this Learn lesson. Others in the Learn gallery include predicting coral bleaching, modeling landslide susceptibility, estimating solar potential, classifyi...
What resources are you using? I look forward to your comments.
You must be a registered user to add a comment. If you've already registered, sign in. Otherwise, register and sign in.
Shifting to Modern Remote Sensing and Image Analysis for Teaching and Research using ArcGIS: List of Resources
Teaching Modern Image Analysis and Remote Sensing Webinar
-
Administration
90 -
Announcements
88 -
Career & Tech Ed
1 -
Curriculum-Learning Resources
289 -
Education Facilities
24 -
Events
78 -
GeoInquiries
1 -
Higher Education
620 -
Informal Education
286 -
Licensing Best Practices
102 -
National Geographic MapMaker
44 -
Pedagogy and Education Theory
244 -
Schools (K - 12)
282 -
Schools (K-12)
312 -
Spatial data
40 -
STEM
3 -
Students - Higher Education
261 -
Students - K-12 Schools
149 -
Success Stories
45 -
TeacherDesk
1 -
Tech Tips
130
- « Previous
- Next »