- Home
- :
- All Communities
- :
- Industries
- :
- Education
- :
- Education Blog
- :
- Teaching about Earth Changes and Remote Sensing wi...
Teaching about Earth Changes and Remote Sensing with the new Landsat Explorer App
- Subscribe to RSS Feed
- Mark as New
- Mark as Read
- Bookmark
- Subscribe
- Printer Friendly Page
- Report Inappropriate Content
How can Earth changes be effectively, quickly, and engagingly taught? How can remote sensing principles be taught in an interactive way? The new Landsat Explorer app can serve as a tool, method, and a data set to do just that, as this essay and lesson explains.
The ArcGIS Living Atlas of the World is a collection of authoritative, metadata-rich geographic information from around the globe. Its 8,500 layers includes maps, data layers, and apps. The Atlas is "living" in 2 ways: (1) The content updates continuously with new resources; and (2) Some of the layers are from live feeds, including earthquakes, wildfire perimeters, traffic, streamflow, weather, and many more. The ArcGIS Living Atlas apps (https://livingatlas.arcgis.com/en/apps/) are web mapping applications that use selected content from ArcGIS Living Atlas of the World on specific themes, topics, and tools. They offer several advantages in teaching:
- They require no sign in; only a web browser and an internet connection is needed.
- They point to data that are rich in content and illustrate that we are living in a measured and complex world.
- They feature maps as analytical tools (why things are where they are) and not just reference documents (where something is).
- They cover topics and themes that are widely taught, including ocean chemistry, population change, precipitation, natural hazards, and many more. Thus they can be used in GIS courses and in courses outside of GIS, such as physical and cultural geography, economics, history, city planning, agriculture, and others.
- They focus on change over space and time, central to many disciplines.
- They highlight the connection between Earth spheres (the lithosphere, atmosphere, anthroposphere, hydrosphere, biosphere, and others).
- They give students the tools and data to think spatially and realize the power of GIS.
- They are tied to real locations, real data, and real issues, and thus can be used to teach current events (illustrated with a lesson on current wildfires, here).
- They offer multiple levels of instruction—using the app as is without signing in (Level I), bringing in the data into ArcGIS Online or ArcGIS Pro for further analysis and adding additional layers (Level II), and using the ideas presented in the apps for students to develop their own apps (Level III).
- They touch on the forces and trends of community science, storytelling with maps, and Web-enabled GIS and data as services.
Let’s illustrate the above advantages in instruction with one new, amazing app: The Landsat Explorer App.
The Landsat Explorer App
Landsat is the longest running spaceborne earth imaging and observation program in history, managed by the USGS and NASA. The Landsat program began in 1972, with the launch of Landsat 1, providing a long-running continuous scientific record for critical and reliable observation and analysis of Earth processes and changes over time. The Landsat Level-2 multispectral imagery is available in ArcGIS Living Atlas of the World as a dynamic time enabled image service, accessible across the ArcGIS system and used to power this app.
Use the app to understand land use and land change associated with urbanization, drought, wildfire, volcanism, and other natural processes, processes associated with human activity such as urbanization, deforestation, reforestation, construction of reservoirs, and processes that represent a combination of natural and human-influenced change, such as coastal erosion, glacial retreat and other climate change indicators, and more. The app’s item page provides more detail. For more information, see these essays about the launch (https://www.esri.com/arcgis-blog/products/arcgis-living-atlas/imagery/landsat-explorer-earth-science...), and its new data https://community.esri.com/t5/arcgis-living-atlas-blog/unlock-the-wealth-of-information-in-landsat-l....
The app offers an easy-to-use interface that makes it intuitive to teach with. Some of the key capabilities include:
Visual exploration of a dynamic global mosaic of the best available Landsat scenes for any area of the planet and across a 50 year time period.
On-the-fly multispectral band combinations and indices for visualization and analysis.
Interactive Find a Scene by location, sensor, time, and cloud cover.
Analyze change over space and time; compare the same area with different renderings, using the Swipe and Animation tools.
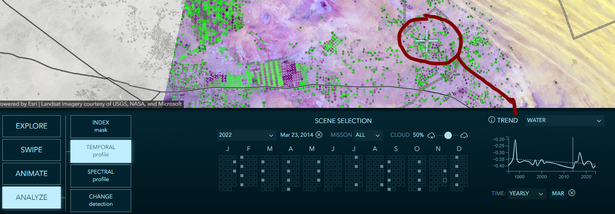
Create threshold masks and temporal profiles for vegetation, water, land surface temperature, and more.
The Landsat Explorer Interface
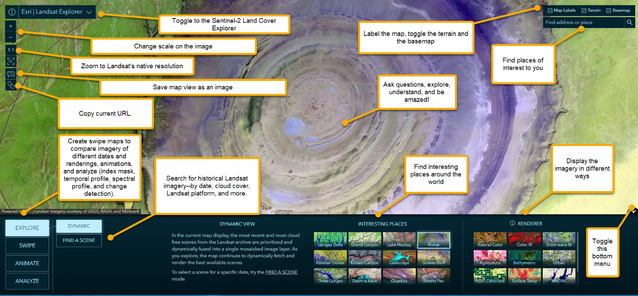
The interface of the Landsat Explorer is straightforward and intuitive, but it offers a great deal of power! See some of its main features in the graphic below. Try them all!
5 Selected Investigations using the Landsat Explorer App
Access the Landsat Explorer app and try the following 5 activities, but we also encourage you and your students to do your own further investigations.
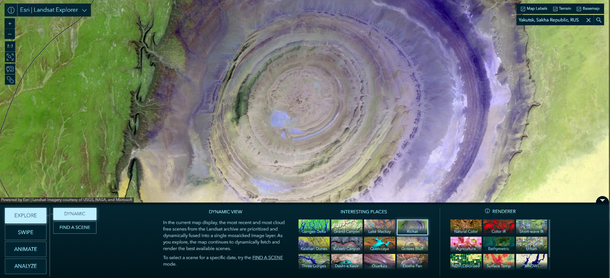
- Go to > Interesting places and explore a few listed here. One of our favorites listed is Richat, in Mauritania (shown here). Conduct your own investigation as to the origin of Richat and encourage students to do so of a place they are interested in. Use the search tool to go beyond the Interesting Places collection to your own location, or another area you are interested in. Some of our favorites are coastal England at Eastbourne, central Saudi Arabia’s center pivot irrigation circles, and the active volcanoes on Kamchatka. Also use the Find a Scene to find a scene of a particular year and cloud cover for a particular area. The Find a Scene mode lets you specify a year and see all available images for that entire year in a single calendar view. Images meeting the selected cloud cover tolerance are displayed as solid blocks, while available scenes that do not meet the cloud tolerance are shown as outlines.
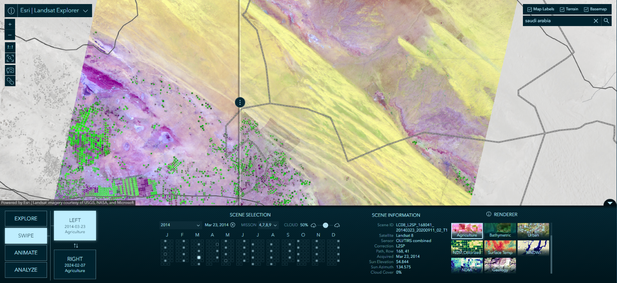
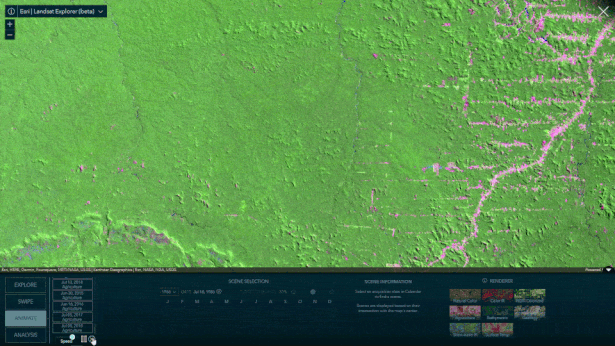
- Use the Swipe and Animate tools on the left and select scenes at specific dates to see change over time. Compare, say, a rapidly changing place such as Kuala Lumpur, central Saudi Arabia (shown below) or Dallas to a slowly changing place such as southeastern Libya or western Kansas USA. What changes are occurring, and why are they occurring at different rates? How does the rate of change in your area compare to those in other locations?
See one of the most rapidly changing places on the Earth, in Rondonia, Brazil, here and below. Why is it changing so rapidly? - Compare the spatial resolution, the coverage, and the band combinations of the different Landsat missions (4, 5, 7, 8, 9) that you have access to in this app. Use the information on each scene that you examine to reinforce concepts in remote sensing such as the electromagnetic spectrum.
- Use the temporal profile to analyze moisture, water, surface temperature, and other variables across a scene, and compare these variables to an area in a completely different biome (example below).
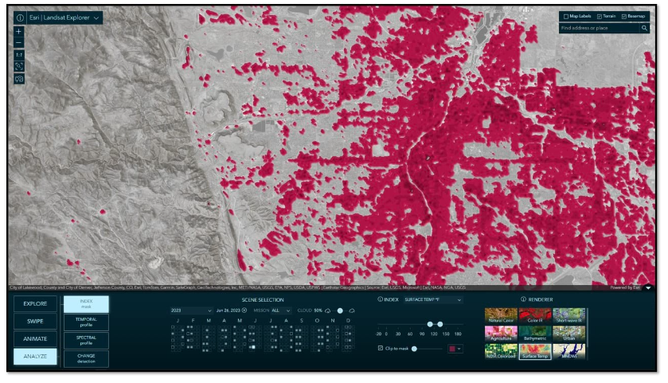
- Use the Analysis > Mask tool to quickly delineate surface conditions, such as surface water, temperature, and vegetation, with spectral and index thresholding. Render the results as a solid color mask on top of the imagery or as a clipping mask to reveal only the pixels within the specified threshold. Using these tools, you could show areas with the healthiest vegetation and in the same area, show the hottest surface temperature in an area, to determine if there is a correlation between the lack of vegetation and the hottest surface areas (hottest areas around Denver on a specific data shown below).
Teaching Recommendations
(1) Use the above guidance but use the tools and data behind them to meet your own curricular goals. While using the tools, ask “What would happen if we changed the way the imagery is rendered? What if we looked at this region of the world instead of that region? What if we changed the scale? How does where we live compare to areas nearby and far from us?
(2) While using the tools, ask students, “what’s where, why is it there, and why should we care?” Why should we care about [water quality / deforestation / coastal erosion / and other pressing issues of our planet”?
(3) The tools are engaging and useful, but teaching and learning with GIS is never about just gaining GIS skills. While teaching about the tools, simultaneously teach about content—whether that content is focused on healthy vs diseased vegetation, irrigated vs non irrigated agriculture, land use change, biomes and ecoregions, the influence of topography and oceans on climate and subsequently on human settlement, and other themes.
(4) Compare the resolution and band combinations available in the Landsat Explorer to the imagery in the Wayback Imagery App https://livingatlas.arcgis.com/wayback/#active=60013&mapCenter=-115.29850%2C36.06400%2C14)
and the Sentinel-2 Land Cover Explorer app
What is similar about the imagery between these 3 apps? What is different? How is each of the apps useful in investigating Earth processes and changes?
(4) Get into the data behind the app—use this opportunity to investigate Landsat and other types of remotely sensed imagery. What are its advantages? What are its limitations? Investigate some of the data and society discussions via this book and blog.
For Further Exploration
Bern Szukalski and I taught about the Landsat Explorer tool in our recent Esri GIS Higher Education chat, along with other ArcGIS Living Atlas apps that you can explore in this story map. The recording of that chat is in the archives for March 2024, here.
I look forward to hearing how you are using the app!
You must be a registered user to add a comment. If you've already registered, sign in. Otherwise, register and sign in.
-
Administration
39 -
Announcements
45 -
Career & Tech Ed
1 -
Curriculum-Learning Resources
180 -
Education Facilities
24 -
Events
47 -
GeoInquiries
1 -
Higher Education
520 -
Informal Education
266 -
Licensing Best Practices
47 -
National Geographic MapMaker
17 -
Pedagogy and Education Theory
187 -
Schools (K - 12)
282 -
Schools (K-12)
185 -
Spatial data
24 -
STEM
3 -
Students - Higher Education
232 -
Students - K-12 Schools
86 -
Success Stories
22 -
TeacherDesk
1 -
Tech Tips
83
- « Previous
- Next »
