- Home
- :
- All Communities
- :
- Industries
- :
- Education
- :
- Education Blog
- :
- Teaching about Africa using Web GIS tools
Teaching about Africa using Web GIS tools
- Subscribe to RSS Feed
- Mark as New
- Mark as Read
- Bookmark
- Subscribe
- Printer Friendly Page
My colleagues and I have had numerous inquiries over the years from educators asking, "How do I teach a specific topic with the expanding variety of web GIS tools and data sets?" and these inquiries also exist on GeoNet, in the National Geographic educators network, and elsewhere. Let's take one specific example, a set of resources I sent to an educator who is putting together units on the history, colonialization, and geography of Africa for her social studies course. My list of 10 tools included the following:
- Examine the interactive David Rumsey 1787 map of Africa: Discuss: How much detail was included? What was left off? What lands did local people know about? https://www.arcgis.com/home/webmap/viewer.html?webmap=d00c929a180b43fa9cc3ea32892edbbc Then examine the 1790 Cassini map cast on an Esri 3D globe: https://ralucanicola.github.io/JSAPI_demos/cassini-globe/ Discuss the differences between the 1787 and the 1790 maps. What modern countries occupy where “Nubia” and “Abissinia” were in the past?
- Study the ecological tapestry map. In Africa, compare the bioclimates, landforms, rock type, land cover: https://livingatlas.arcgis.com/ecoexplorer/ For more on ecological units, see story map: https://story.maps.arcgis.com/apps/MapJournal/index.html?appid=dc91db9f6409462b887ebb1695b9c201&webm...
- Examine the Esri international migration map in the "cool maps" gallery: https://coolmaps.esri.com/#10 Examine the metadata: Where did the data come from? What time periods does it cover? How accurate is the data? Stop the animation. Select South Africa and examine incoming and outgoing migration over the 5 time periods. Compare to another country in Africa, noting the differences in numbers and spatial patterns. How many emigrate to the USA from each country? Change to Somalia and discuss reasons the total numbers are so much lower and why outgoing is much more than incoming. Discuss challenges there (food security, political instability) and what causes people to decide to stay vs what causes them to emigrate, and - what hinders them from emigrating.
- Access the Esri Water Balance app: https://livingatlas.arcgis.com/waterbalance/ Go to > “precipitation” > compare regions in Africa, especially Sahara versus the topical regions. Change to “soil moisture” and discuss relationship. Change to “snowpack” – make sure graph is on Monthly Normal. Does it snow anywhere in Africa? Go to Atlas Mountains in Morocco and then examine Mt Kilimanjaro on the Kenya Tanzania border where some snow exists (for now, anyway, but perhaps not in the future). Supplement this activity with the seasonal change in snow cover map and animation, that I describe in detail, here: https://community.esri.com/community/education/blog/2016/02/12/seasonal-changes-in-snow-cover-map.
- Go to ArcGIS Online (www.arcgis.com) and search for Baltimore Maryland. Pan north and south along the east coast of the USA, noting the abundance of harbors. Then search for Mombassa Kenya. Pan in both directions along the coast and note the absence of good harbors, with Mombassa being one exception, and discuss the implications of the lack of harbors and the table-land geography of Africa, and the implications on the patterns and amount of exploration and development and colonialism.
- Use MapMaker Interactive from National Geographic: https://mapmaker.nationalgeographic.org/#/ Add data > add climate, language diversity, religion. Discuss language and religion influence from colonialism and other forces. Show legend and discuss the patterns, relationships, and trends.
- Go to Google Maps, and zoom to Kenyatta Ave & Uhuru Hwy, in Nairobi > Street View (drag street view person to map) > discuss influence of the British colonialism on: architecture, the roundabout, the side of the street people are driving on, the manicuring of the parks, and more. Examine French and other colonial influences elsewhere in Africa. Where StreetView does not exist, you can use the Mapillary citizen-science generated images on www.mapillary.com.
- Study the pattern and amount of urban growth in Cairo using the Esri Wayback imagery app: https://livingatlas.arcgis.com/wayback/ > go to Great Pyramids > Check “only updates with local changes > pan to the area to the west of the pyramids, observing the 2014 to 2018 changes. Discuss the implications of urban growth on society, schools, and natural resources. Using the same app, examine the impact of urban growth in Tunis, Lagos, Johannesburg, and selected small villages of your choice. Using the same app, determine if you can detect other changes on the landscape, whether from political instability, expansion of agriculture or energy exploration, encroachment of the Sahara on the Sahel, tourism infrastructure growth, the impact of national parks and preserves on the return of forested land, and other changes.
- Use a selection of the GeoInquiries collections to investigate physical and cultural themes in Africa: GeoInquiries | Standards-Based Inquiry Activities for Teaching Map-Based Content . For example, examine population growth as part of the "Growing Pains" unit under the World History collections. These lessons were built for primary and secondary school instructors, but if you are instructing at the university level, you can still use the interactive maps tied to these lessons and insert your own questions.
- Investigate the world's largest cities, including those in Africa, via the 3D ArcGIS Globes here: Get creative with globe visualizations . Next, examine global population density and compare to world cities. Why are zones sparsely populated in Africa a short distance away from heavily populated zones, such as in Nigeria and in Egypt? Next, examine the population density filter tool on the same site and slide the filter tool so that you are only examining high density population areas across the continent. What are the physical, cultural, and historical reasons for the population settlement patterns in Africa?
These maps, data layers, tools, and questions can be applied to other areas of the world, as well. By using these tools in a problem-solving, inquiry-driven educational environment, students become investigators, thinking spatially and critically, and asking even deeper questions than the ones posed here.
How are you using these tools in your courses and classrooms?
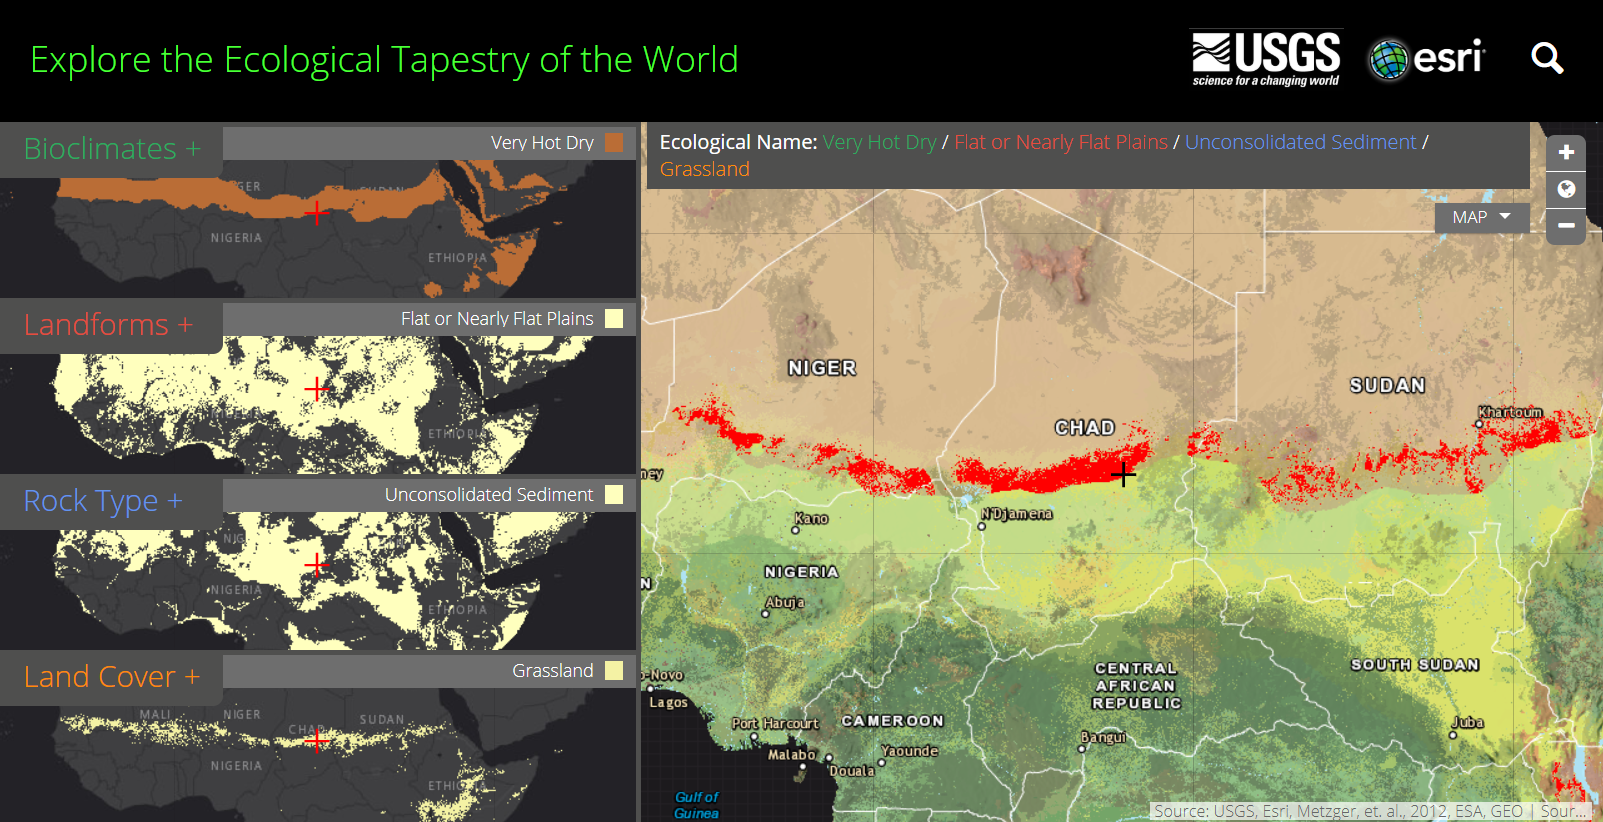 Ecological Land Units map focused on central Africa.
You must be a registered user to add a comment. If you've already registered, sign in. Otherwise, register and sign in.
-
Administration
90 -
Announcements
88 -
Career & Tech Ed
1 -
Curriculum-Learning Resources
288 -
Education Facilities
24 -
Events
78 -
GeoInquiries
1 -
Higher Education
620 -
Informal Education
286 -
Licensing Best Practices
102 -
National Geographic MapMaker
44 -
Pedagogy and Education Theory
243 -
Schools (K - 12)
282 -
Schools (K-12)
311 -
Spatial data
40 -
STEM
3 -
Students - Higher Education
261 -
Students - K-12 Schools
149 -
Success Stories
45 -
TeacherDesk
1 -
Tech Tips
130
- « Previous
- Next »