Turn on suggestions
Auto-suggest helps you quickly narrow down your search results by suggesting possible matches as you type.
Cancel
- Home
- :
- All Communities
- :
- Industries
- :
- Education
- :
- Education Blog
- :
- Play Ball! Examining the World Series, Baseball, a...
Play Ball! Examining the World Series, Baseball, and Other Sports Using ArcGIS Online
Subscribe
336
2
06-28-2017 11:45 PM
- Subscribe to RSS Feed
- Mark as New
- Mark as Read
- Bookmark
- Subscribe
- Printer Friendly Page
- Report Inappropriate Content
06-28-2017
11:45 PM
I have created a new presentation using ArcGIS Online to invite exploration of the spatial aspects of baseball teams, players, stadiums, and the sport itself. The goal of the presentation is to use the familiar and interesting topic of baseball as a starting point for exploring spatial data at a variety of scales, to ask geographic questions, and to use WebGIS in the process.
Baseball is a spatial sport. The bases are a standard “space” or distance apart, the fielders are assigned certain locations on the field, the offense has a prescribed direction to tag and run the bases, and the players, umpires, coaches, and warm-up pitchers have prescribed areas in the stadium in which to work. Even the fans have certain areas in which they can sit, and the proximity to the field and other amenities determines the ticket price. Angles are of crucial importance as the ball is thrown, hit, and fielded.
In short, spatial considerations run throughout the sport of baseball. Baseball stadiums are constructed in certain locations and markets and affect local and regional transportation patterns, local economies, land use, and even local drainage and impervious surface. The birthplace of players and affiliated radio and TV stations also form regional and, these days, even international patterns.
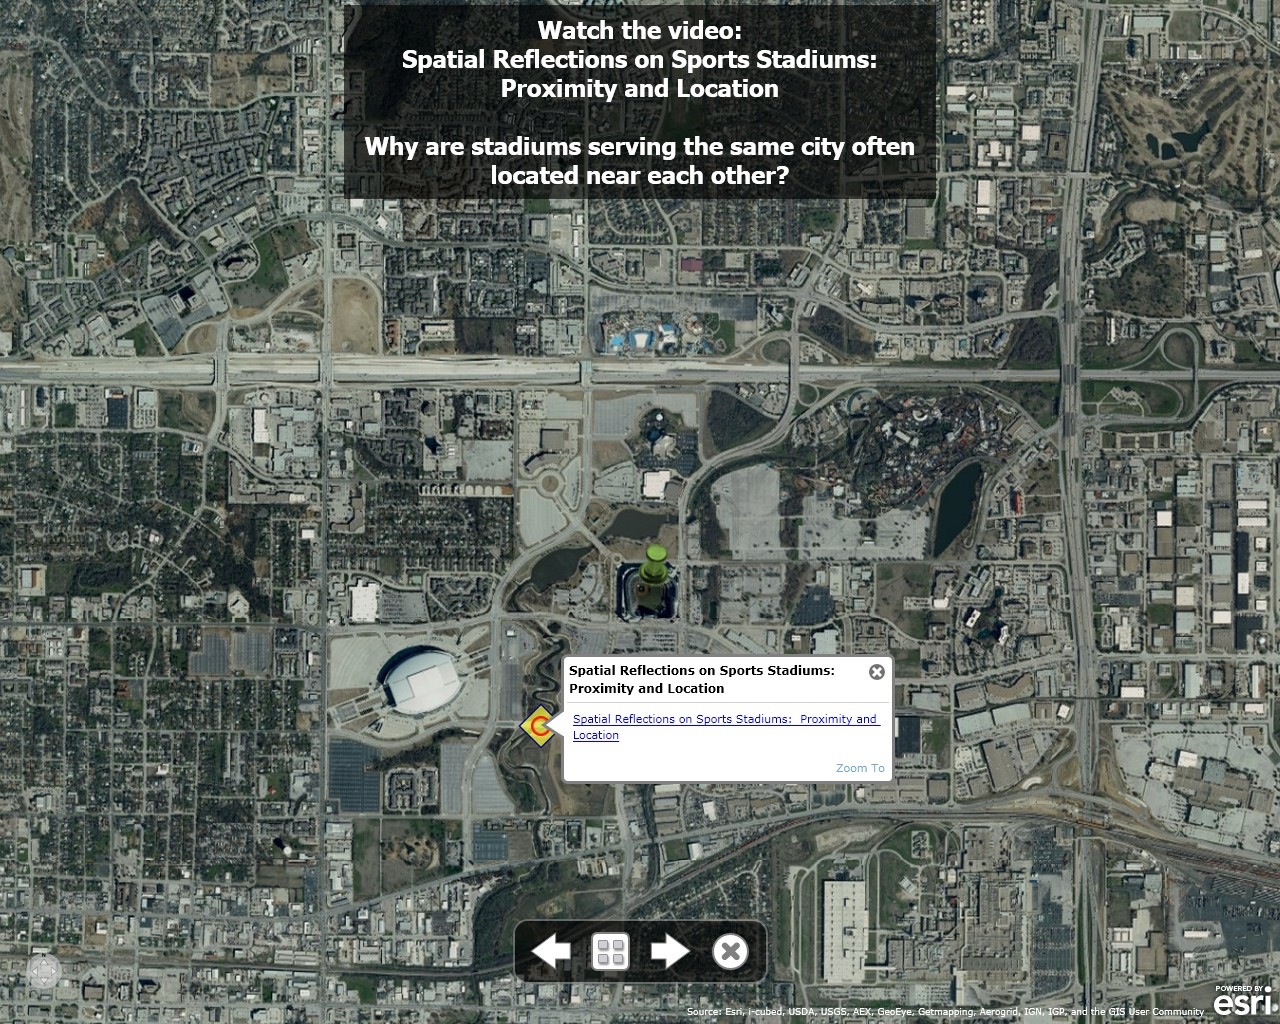
The presentation includes discussion and data on the distribution of radio stations broadcasting major league baseball games, the distribution of the birthplaces of baseball players, population density and neighborhood characteristics, access to and proximity of stadiums, comparing stadiums in different cities, comparing different types of sports stadiums, and much more. A total of 7 videos linked to the presentation invite deeper reflection. Spatial questions are embedded throughout the presentation. Actually, the word “presentation” does not adequately fit the wonderful and powerful capabilities built into ArcGIS Online. This presentation includes 53 slides, but at any point, the user of these slides can exit the presentation mode, zoom and pan, add additional data, change symbology, change the base map, or examine a different issue. The presentation mode in ArcGIS Online can serve as an excellent storytelling tool for students studying biology, chemistry, geography, history, mathematics, as well as a convenient and authentic means for instructors to assess student work.
How might you use this activity, and ArcGIS Online, to promote spatial thinking through sports?
-Joseph Kerski, Esri Education Manager
2 Comments
You must be a registered user to add a comment. If you've already registered, sign in. Otherwise, register and sign in.
About the Author
I believe that spatial thinking can transform education and society through the application of Geographic Information Systems for instruction, research, administration, and policy.
I hold 3 degrees in Geography, have served at NOAA, the US Census Bureau, and USGS as a cartographer and geographer, and teach a variety of F2F (Face to Face) (including T3G) and online courses. I have authored a variety of books and textbooks about the environment, STEM, GIS, and education. These include "Interpreting Our World", "Essentials of the Environment", "Tribal GIS", "The GIS Guide to Public Domain Data", "International Perspectives on Teaching and Learning with GIS In Secondary Education", "Spatial Mathematics" and others. I write for 2 blogs, 2 monthly podcasts, and a variety of journals, and have created over 5,000 videos on the Our Earth YouTube channel.
Yet, as time passes, the more I realize my own limitations and that this is a lifelong learning endeavor and thus I actively seek mentors and collaborators.
Labels
-
Administration
42 -
Announcements
48 -
Career & Tech Ed
1 -
Curriculum-Learning Resources
189 -
Education Facilities
24 -
Events
49 -
GeoInquiries
1 -
Higher Education
528 -
Informal Education
266 -
Licensing Best Practices
50 -
National Geographic MapMaker
18 -
Pedagogy and Education Theory
193 -
Schools (K - 12)
282 -
Schools (K-12)
192 -
Spatial data
24 -
STEM
3 -
Students - Higher Education
233 -
Students - K-12 Schools
90 -
Success Stories
23 -
TeacherDesk
1 -
Tech Tips
84
- « Previous
- Next »