Turn on suggestions
Auto-suggest helps you quickly narrow down your search results by suggesting possible matches as you type.
Cancel
- Home
- :
- All Communities
- :
- Industries
- :
- Education
- :
- Education Blog
- :
- Mapping Weather Balloon Data in 2D and 3D
Mapping Weather Balloon Data in 2D and 3D
Subscribe
1826
0
09-25-2015 12:00 AM
- Subscribe to RSS Feed
- Mark as New
- Mark as Read
- Bookmark
- Subscribe
- Printer Friendly Page
09-25-2015
12:00 AM
The Cherry Creek School District in Colorado has been using GIS in the curriculum and in administration for many years now. When the STEM coordinators of the district told me recently that their students were launching weather balloons and recording atmospheric data from them, I jumped at the opportunity to show them how easy and powerful it is to map the data in ArcGIS Online. The data from just one of the many balloons they had launched was stored in a standard spreadsheet and contained latitude and longitude coordinates, and therefore was a snap to map in ArcGIS Online. This particular balloon, launched on 1 May 2015, flew over 56 miles (100 km) in 3 hours and 6 minutes, reaching a maximum altitude of 30.7 km, recording a minimum temperature of -59.3 C and achieving a maximum speed of 114 km/hour. I mapped the balloon based on its height on a satellite image base, which you can examine in ArcGIS Online by clicking on the map below.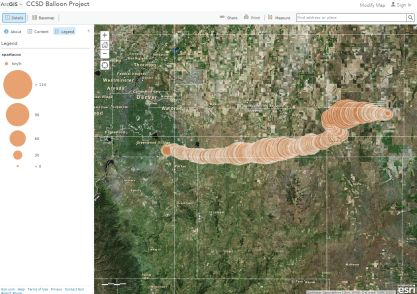
Since balloons fly in 3D space, a natural next step was to map the data as a 3D scene. I used ArcGIS Pro to extrude selected attributes, such as height, and published the scene to ArcGIS Online, shown in two views and symbologies, below: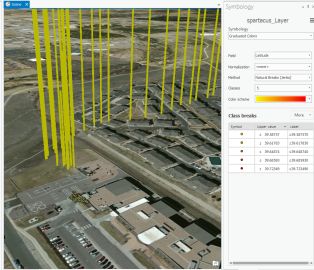
The track of this particular balloon followed the typical west-to-east prevailing winds, but as it neared the tropopause, it encountered stronger winds from the southeast, that not only blew it in the opposite direction, but also blew it higher in the atmosphere.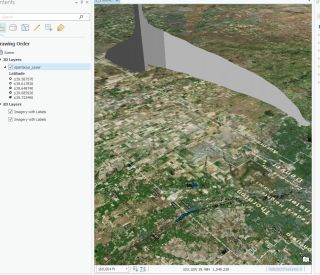
What excites me not only is the ability of these tools to map the data that the students are collecting, but the power that they offer in terms of helping students understand the relationships among all of these variables. The variables in this case included altitude, speed, heading, and temperature, but other data that the students have collected include atmospheric quality characteristics. GIS provides a fundamental component of the district's STEM goals, perspectives, content knowledge, and skills. Another thing about this project that excites me is that -- Grade 5 students are the ones engaged in this project--yes, 11 years olds, collecting and analyzing data!
Think about the kinds of data that you and your students work with. It may not be weather balloon data, but it occurs over space and time. How could you use ArcGIS Online and the 3D scene viewer to map and understand your data?
2D map of weather balloon mapped by speed in ArcGIS Online.
Since balloons fly in 3D space, a natural next step was to map the data as a 3D scene. I used ArcGIS Pro to extrude selected attributes, such as height, and published the scene to ArcGIS Online, shown in two views and symbologies, below:
3D scene of weather balloon at its launch point mapped in ArcGIS Online.
The track of this particular balloon followed the typical west-to-east prevailing winds, but as it neared the tropopause, it encountered stronger winds from the southeast, that not only blew it in the opposite direction, but also blew it higher in the atmosphere.
3D scene of weather balloon mapped by height in ArcGIS Online, looking southeast.
What excites me not only is the ability of these tools to map the data that the students are collecting, but the power that they offer in terms of helping students understand the relationships among all of these variables. The variables in this case included altitude, speed, heading, and temperature, but other data that the students have collected include atmospheric quality characteristics. GIS provides a fundamental component of the district's STEM goals, perspectives, content knowledge, and skills. Another thing about this project that excites me is that -- Grade 5 students are the ones engaged in this project--yes, 11 years olds, collecting and analyzing data!
Think about the kinds of data that you and your students work with. It may not be weather balloon data, but it occurs over space and time. How could you use ArcGIS Online and the 3D scene viewer to map and understand your data?
You must be a registered user to add a comment. If you've already registered, sign in. Otherwise, register and sign in.
About the Author
I believe that spatial thinking can transform education and society through the application of Geographic Information Systems for instruction, research, administration, and policy.
I hold 3 degrees in Geography, have served at NOAA, the US Census Bureau, and USGS as a cartographer and geographer, and teach a variety of F2F (Face to Face) (including T3G) and online courses. I have authored a variety of books and textbooks about the environment, STEM, GIS, and education. These include "Interpreting Our World", "Essentials of the Environment", "Tribal GIS", "The GIS Guide to Public Domain Data", "International Perspectives on Teaching and Learning with GIS In Secondary Education", "Spatial Mathematics" and others. I write for 2 blogs, 2 monthly podcasts, and a variety of journals, and have created over 6,500 videos on my Our Earth YouTube channel.
Yet, as time passes, the more I realize my own limitations and that this is a lifelong learning endeavor: Thus I actively seek mentors and collaborators.
Related Articles
Mapping Weather Balloon Data in 2D and 3D using ArcGIS Online
JosephKerski
Esri Alum
1 Kudos
0 Comments
Labels
-
Administration
90 -
Announcements
88 -
Career & Tech Ed
1 -
Curriculum-Learning Resources
286 -
Education Facilities
24 -
Events
77 -
GeoInquiries
1 -
Higher Education
618 -
Informal Education
286 -
Licensing Best Practices
102 -
National Geographic MapMaker
43 -
Pedagogy and Education Theory
241 -
Schools (K - 12)
282 -
Schools (K-12)
308 -
Spatial data
39 -
STEM
3 -
Students - Higher Education
259 -
Students - K-12 Schools
147 -
Success Stories
44 -
TeacherDesk
1 -
Tech Tips
129
- « Previous
- Next »