- Home
- :
- All Communities
- :
- Industries
- :
- Education
- :
- Education Blog
- :
- Mapping 3D Adventures Using GIS Tools
Mapping 3D Adventures Using GIS Tools
- Subscribe to RSS Feed
- Mark as New
- Mark as Read
- Bookmark
- Subscribe
- Printer Friendly Page
If the future of GIS is 3D, that future is now. As I described a few weeks ago in mapping weather balloon data that students had collected, a number of 3D tools make it possible for educators and their students to map, visualize, and analyze data in three dimensions, or four dimension if one considers time. Certainly, 3D tools have been with us for at least 15 years in the desktop GIS environment, but the advent of web GIS makes these tools easier to use, with the added advantage of sharing them online so that anyone can engage with your 3D data.
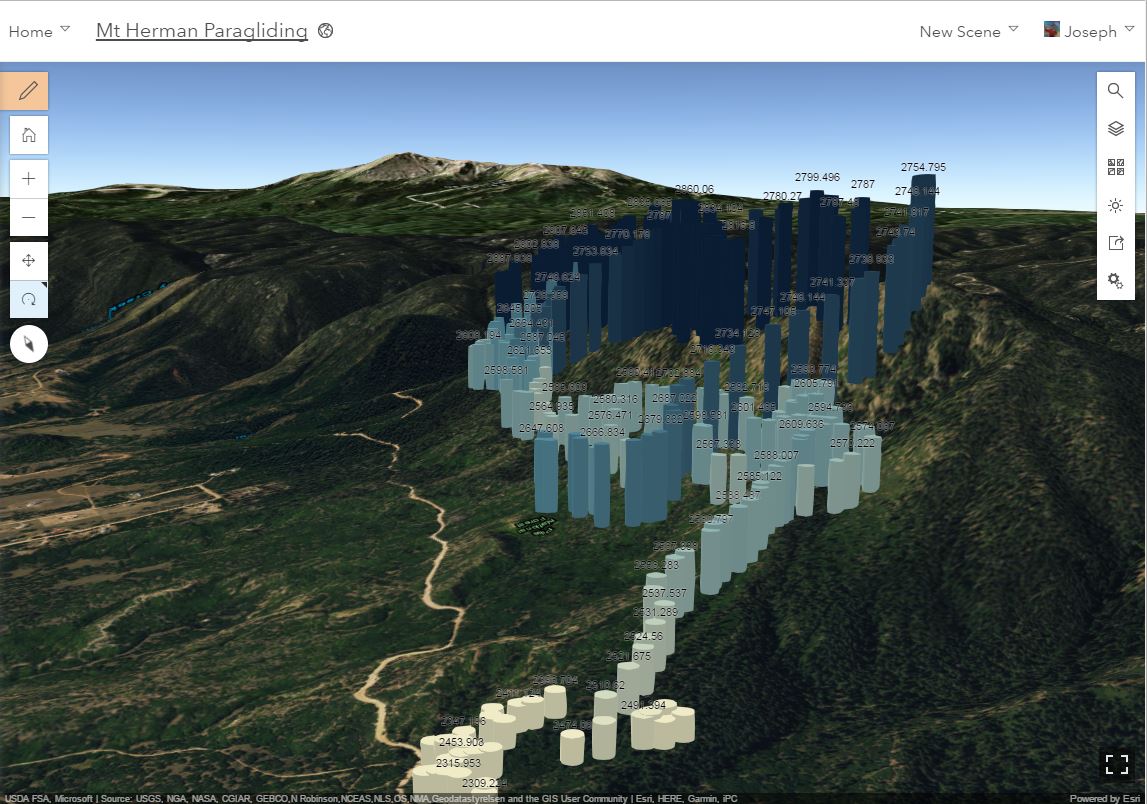
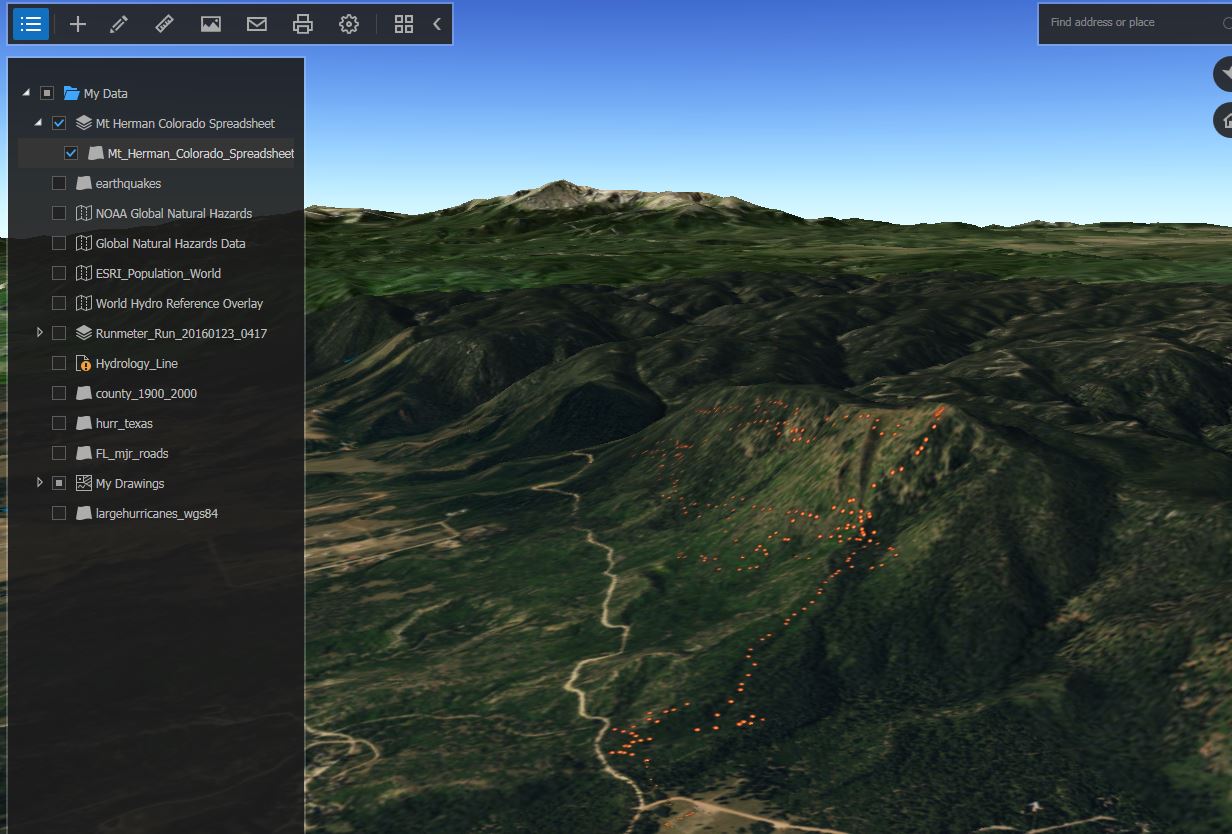
One of these tools is the 3D scene viewer in ArcGIS Online. What if you were to use an adventure or experience that you or your students have had to help them to think in these dimensions? For example, one of my colleagues likes to go paragliding. He gave me the data he collected on a few of his paragliding runs, and since the data was in an Excel spreadsheet, I could easily bring it in as a CSV file into ArcGIS Online. From there, I created a service and added that service to the 3D Scene Viewer, shown below, with a link to 3D Scene Viewer so that you can interact with it. This is on Mount Herman along the Colorado Front Range, and that mountain in the distance is Pikes Peak.
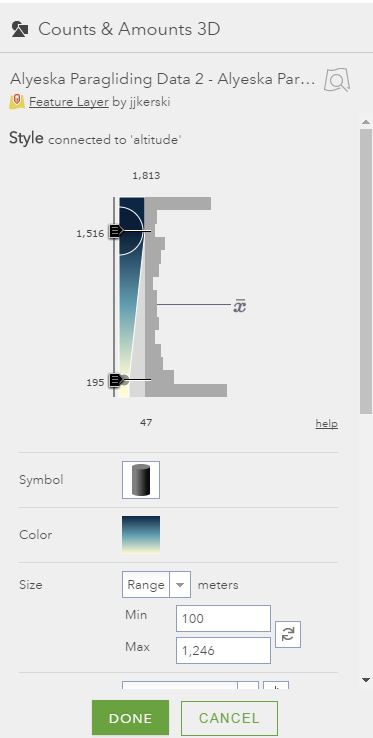
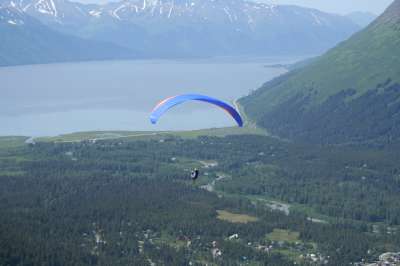
I used the 3D cylinders on altitude to map my colleague's position. You can adjust the style, color, and size, and the elevation mode (relative to ground, on the ground, absolute height) as needed to make your 3D scene as realistic as possible and to meet your educational goals. For example, here are the symbols I chose for my colleague's run down the ski slope at Alyeska, Alaska:
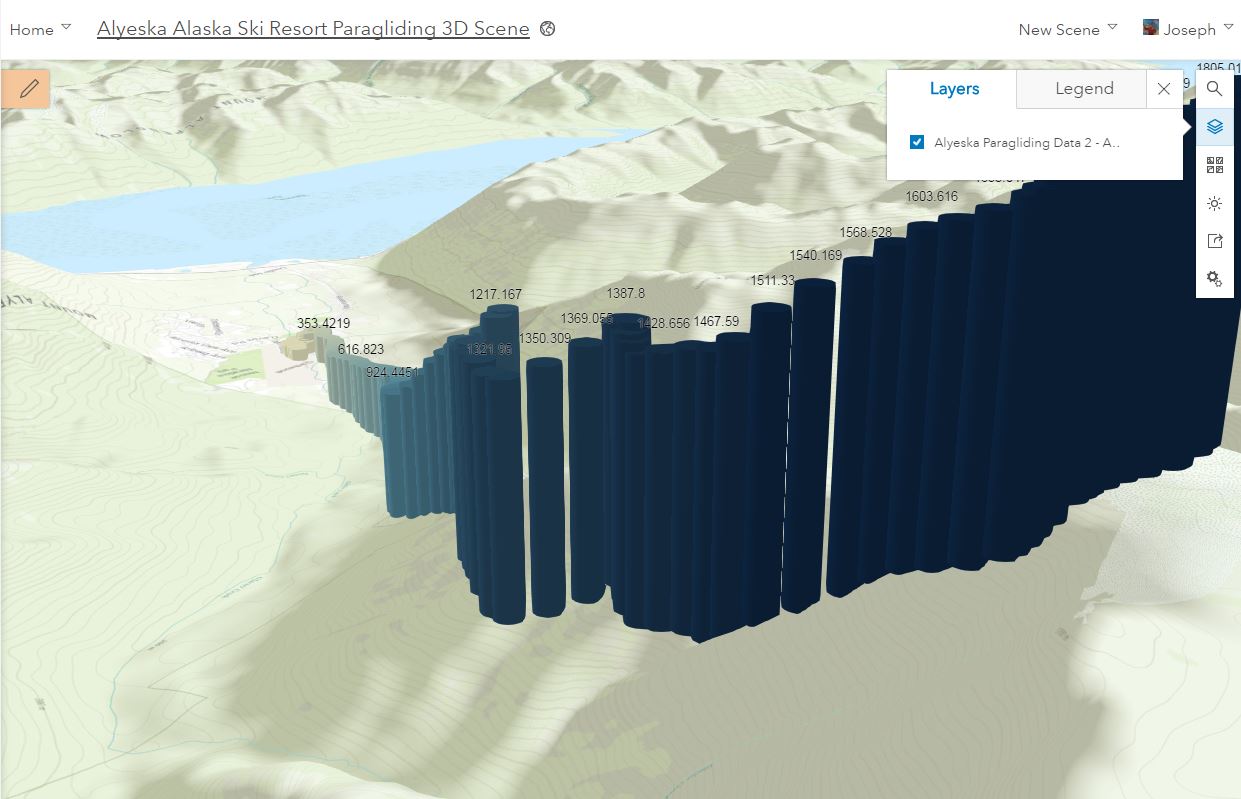
The results are shown below. You can see that I also labeled the cylinders by elevation and color-coded them with the same variable. The URL is here so that you can interact with it.
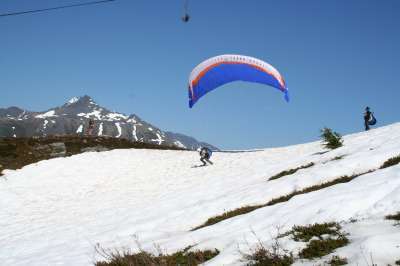
Here are a few images of my colleague as he started off and as he sailed down the valley:
I also brought the Mt Herman data into ArcGIS Earth, shown below:
My colleague likes to go paragliding and collect data during these adventures. What are you or your students passionate about doing in the field? It could be scuba diving, hang gliding, sky diving, caving, downhill or cross country skiing, hiking, bicycling, motorcycling, kayaking, canoeing, or something else. Whatever it is, consider using those interesting and personal experiences to help your students think in spatial and temporal dimensions, and to start them on their journey in using GIS tools.
You must be a registered user to add a comment. If you've already registered, sign in. Otherwise, register and sign in.
-
Administration
90 -
Announcements
88 -
Career & Tech Ed
1 -
Curriculum-Learning Resources
288 -
Education Facilities
24 -
Events
78 -
GeoInquiries
1 -
Higher Education
620 -
Informal Education
286 -
Licensing Best Practices
102 -
National Geographic MapMaker
44 -
Pedagogy and Education Theory
243 -
Schools (K - 12)
282 -
Schools (K-12)
311 -
Spatial data
40 -
STEM
3 -
Students - Higher Education
261 -
Students - K-12 Schools
149 -
Success Stories
45 -
TeacherDesk
1 -
Tech Tips
130
- « Previous
- Next »