- Home
- :
- All Communities
- :
- Industries
- :
- Education
- :
- Education Blog
- :
- Hurricane Maria Mapping Project: We Need Your Help
Hurricane Maria Mapping Project: We Need Your Help
- Subscribe to RSS Feed
- Mark as New
- Mark as Read
- Bookmark
- Subscribe
- Printer Friendly Page
Hurricane Maria was the strongest hurricane to make landfall in Puerto Rico since 1928. Originating from a tropical wave that the US National Hurricane Center began monitoring on September 13, Maria developed into a tropical storm on September 16 east of the Lesser Antilles. In conditions remarkably favorable for further development, on September 18, Maria underwent explosive intensification, doubling its sustained wind speed to 260km/h (160 mph), becoming a Category 5 hurricane.
As of October 4, the hurricane has caused no less than 79 deaths. Puerto Rico has suffered catastrophic damage. Total losses from the hurricane are estimated between $15.9 and $95 billion. The entirety of Puerto Rico has been declared a Federal Disaster Zone.
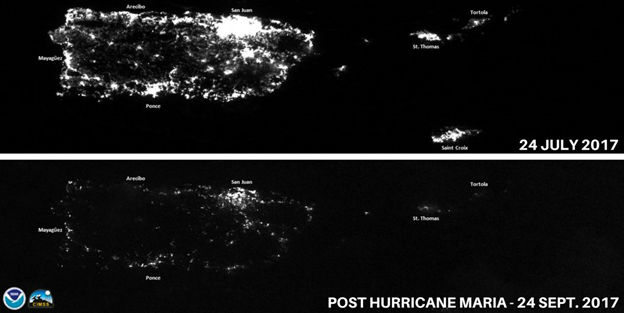
Maps and GIS were used to monitor the development of the hurricane and to coordinate initial rescue efforts. GIS continues to be used to assess damage and help with recovery efforts. In the next two images for example, maps illustrate the effect of the hurricane on the electrical grid. The first map shows an average summer night in Puerto Rico, with the electricity grid working in normal conditions. The second map shows what the activity looked like on September 24 immediately after the hurricane when most of the electricity grid was out of service.
This is one of the many ways geography and maps can be used to help Puerto Rico recover. We propose an activity for students to learn a practical use of GIS technology for emergency recovery operations. This will be a fun yet didactic exercise.
Using high resolution imagery donated by Vexcel Corporation, students will use ArcGIS tools to identify and assess damaged buildings in Puerto Rico. Working as a team, damage across the entire island can be mapped!
Assessing Building Damage Using High Resolution Imagery
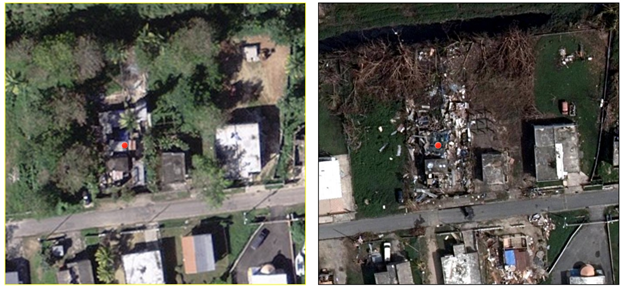
This imagery was captured right after the hurricane, which makes it easy to identify damage. For clarity, proper damage assessments need to be validated on the ground, but the initial interpretation from imagery is a great step to get an initial approximation to the severity of damage.
Here are some examples to illustrate what you can expect. We have a pair of images, one before the hurricane, and one right after it. A small red dot has been added on top of the building indicating that it was completely destroyed.
The next set focuses on an area near the coast. Note that some building have been flagged in green, indicating that no damage has been observed, whereas others are flagged in orange (damage observed) or red (completely destroyed).
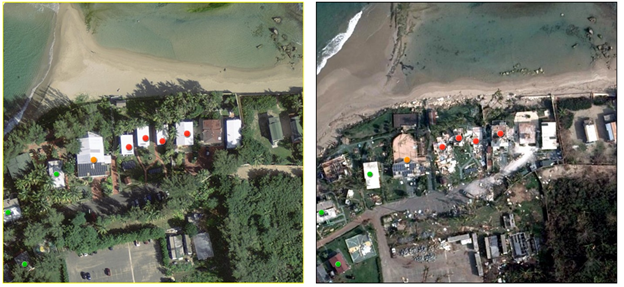
Properly identifying damage takes some practice but can be effectively done through careful observation, common sense, and lots of patience.
Do You Want to Try?
Esri has setup all the aerial imagery required to perform damage inspections in Puerto Rico as shown above. We also have setup a powerful web application that will let students easily compare images pre- and post-hurricane as well as tools to flag buildings.
- Watch this short video to see and understand the process in operation.
- To participate, you will need to join our ArcGIS Online Maria Damage Assessment Exercise Group. Click the link and join the group using your ArcGIS Online Organization credentials. (If your school or youth club does not have an Org account, you can request one.) We recommend that all people in a school or club share a single credential that clearly identifies your group (e.g. "IL_Ourtown_LincolnHS" or "TX_Ourcounty_4Hmappers"), so you and others can look at your team's collective work.
- Once you access the ArcGIS Online Maria Damage Exercise group, open the Damage Assessment Application and start mapping.
- Navigate the map to find an area where you want to start working.
- Engage the swipe tool (upper left) and use it to compare the images before and after the hurricane.
- Engage the edit tool (at left) and use the Green, Orange, and Red tools to flag buildings as appropriate. Emphasize accuracy, not speed.
- To see all points contributed across all teams, open the General Dashboard (improved version allows viewing by contributor).
- [[Added Oct.18]] Please see also the Oct.18 Update, which provides examples and feedback.
- [[Added Nov.13]] Please see also the Nov.13 Blog, which provides important context and results
What is next?
The most important aspect of this exercise is to learn and have fun, but you should know that your contributions have a meaning beyond your own. We at Esri are also learning through this entire process with the intent of enabling similar activities in the future. Thanks for your participation.
[[Note: This document was updated Oct.18 and Nov.13 to clarify the project's purpose and provide links to subsequent write-ups.]]
You must be a registered user to add a comment. If you've already registered, sign in. Otherwise, register and sign in.
-
Administration
90 -
Announcements
87 -
Career & Tech Ed
1 -
Curriculum-Learning Resources
285 -
Education Facilities
24 -
Events
77 -
GeoInquiries
1 -
Higher Education
618 -
Informal Education
286 -
Licensing Best Practices
102 -
National Geographic MapMaker
42 -
Pedagogy and Education Theory
241 -
Schools (K - 12)
282 -
Schools (K-12)
307 -
Spatial data
39 -
STEM
3 -
Students - Higher Education
259 -
Students - K-12 Schools
146 -
Success Stories
44 -
TeacherDesk
1 -
Tech Tips
128
- « Previous
- Next »