How walkable is your community?
- Subscribe to RSS Feed
- Mark as New
- Mark as Read
- Bookmark
- Subscribe
- Printer Friendly Page
I invite you to explore the Community Walkability map I created, here:
https://storymaps.arcgis.com/stories/1e4847f78ec94fd89e960adfabb5ac5c
This is a new ArcGIS storymap, and it also includes a button linked to a survey (created with Survey123), plus an Operations Dashboard that provides real-time information on what has been thus far collected. The message I wish to convey through the creation of this resource is that the combination of these connected tools, all part of the ArcGIS platform, offers amazing capabilities. I have created a video on these procedures, here.
Feel free to contribute to this map, ideally, along with a photo, in your own community or another place you have visited. As you do so, think about the kinds of things YOU and your students, colleagues, stakeholders, friends and family in your communities could be collecting, mapping, and analyzing with these same tools—water quality, graffiti or blight, weather, noise, albedo, types and amount of trash, cell phone signal, historical points of interest, tree height/species/condition, pedestrian or traffic counts, and much more. Start with these procedures, presented as a story map, that will guide you through the process.
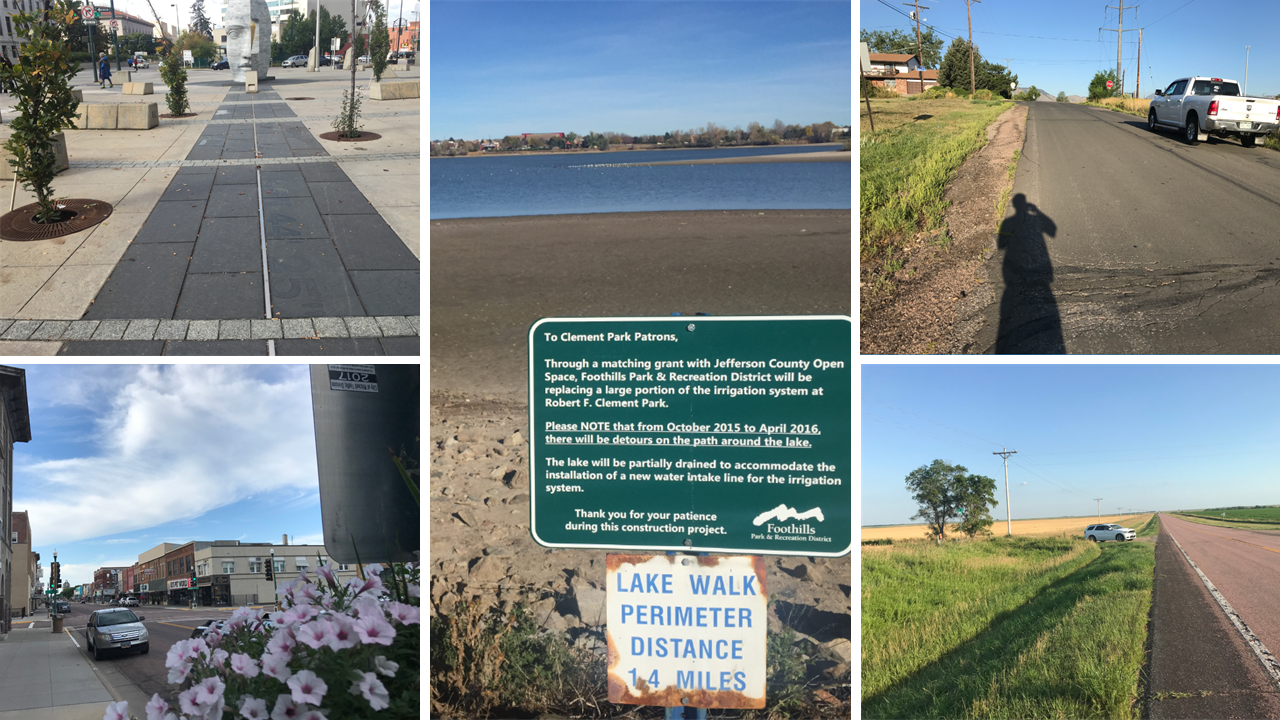
A selection of walkability images submitted to the storymap.
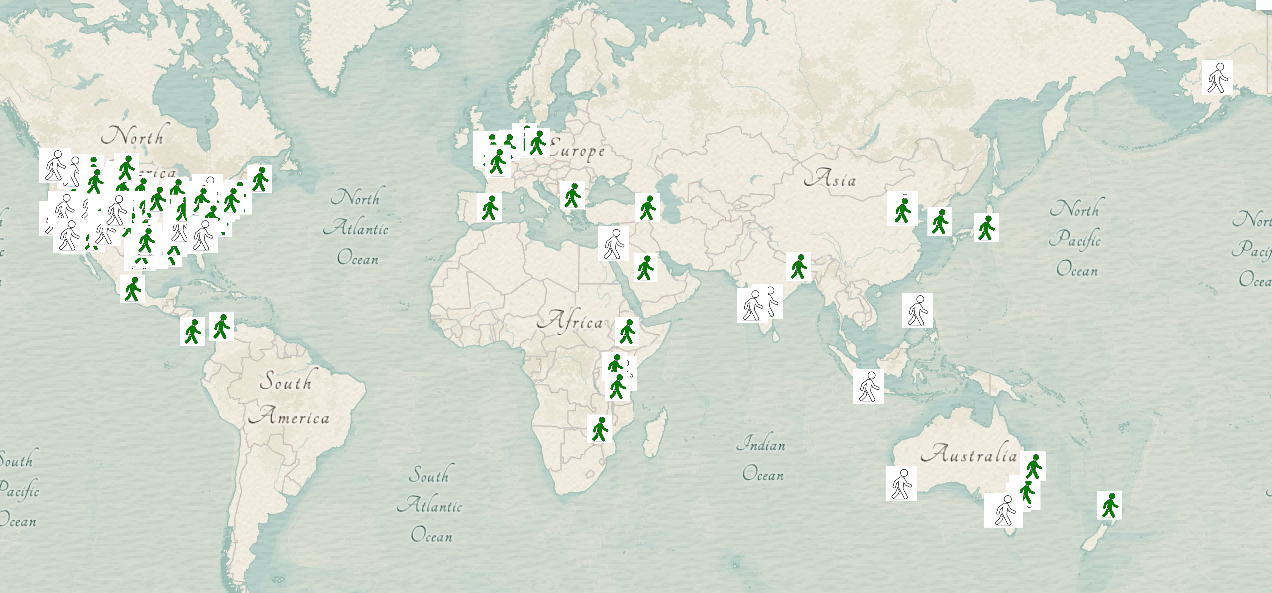
Static screenshot of the walkability map as it appeared in late August 2019; look for more points on the above storymap link, and I encourage you to submit your own point.
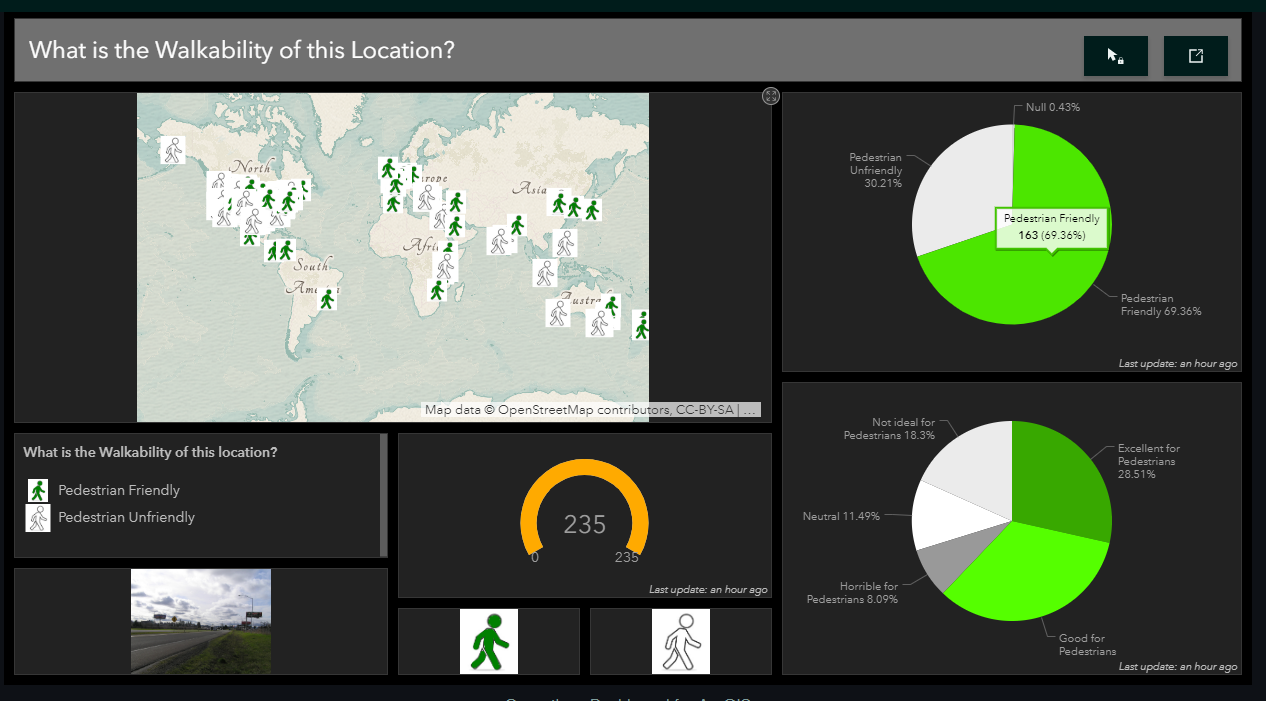
Static screenshot of the walkability operations dashboard as it appeared in September 2019.
You must be a registered user to add a comment. If you've already registered, sign in. Otherwise, register and sign in.
-
Administration
90 -
Announcements
88 -
Career & Tech Ed
1 -
Curriculum-Learning Resources
289 -
Education Facilities
24 -
Events
78 -
GeoInquiries
1 -
Higher Education
620 -
Informal Education
286 -
Licensing Best Practices
102 -
National Geographic MapMaker
44 -
Pedagogy and Education Theory
244 -
Schools (K - 12)
282 -
Schools (K-12)
312 -
Spatial data
40 -
STEM
3 -
Students - Higher Education
261 -
Students - K-12 Schools
149 -
Success Stories
45 -
TeacherDesk
1 -
Tech Tips
130
- « Previous
- Next »