- Home
- :
- All Communities
- :
- Industries
- :
- Education
- :
- Education Blog
- :
- Examining changes over space and time using high-r...
Examining changes over space and time using high-resolution "Wayback" imagery
- Subscribe to RSS Feed
- Mark as New
- Mark as Read
- Bookmark
- Subscribe
- Printer Friendly Page
Examining neighborhood change with historical high-resolution imagery.
The Wayback Image Service. Over 80 different dates of historical imagery for the past 5 years now reside in ArcGIS via the World Imagery Wayback service, as described here: https://www.esri.com/arcgis-blog/products/arcgis-living-atlas/imagery/wayback-81-flavors-of-world-im... . The best place to start for educators is the World Imagery Wayback app. In the app, https://livingatlas.arcgis.com/wayback/, an incredible resource for examining land use and land cover change, changes in water levels of reservoirs, coastal erosion, deforestation, regrowth, urbanization, and much more, covering the entire globe, is at your fingertips within a simple web browser.
The app begins with Las Vegas, Nevada, USA. You are welcome to stay here awhile and examine the massive amount of urban sprawl occurring here. Zoom out and take note of the region in which Las Vegas is situated. What’s wrong with this picture? Do you think a city in the desert is sustainable over the long term? Examine the water level of Lake Mead, a reservoir to the east of the city, over time. What is happening to the water level? In part to divert water to Las Vegas, but in part due to long term drought, the water levels in the reservoir are clearly dropping.
In the upper right of the map, in the search box, enter Casey Hospital, Kangan Dr, Berwick, Victoria, 3806, AUS. Then to the left of the map, click “only updates with local changes” to just display imagery where changes have been noted, as follows:
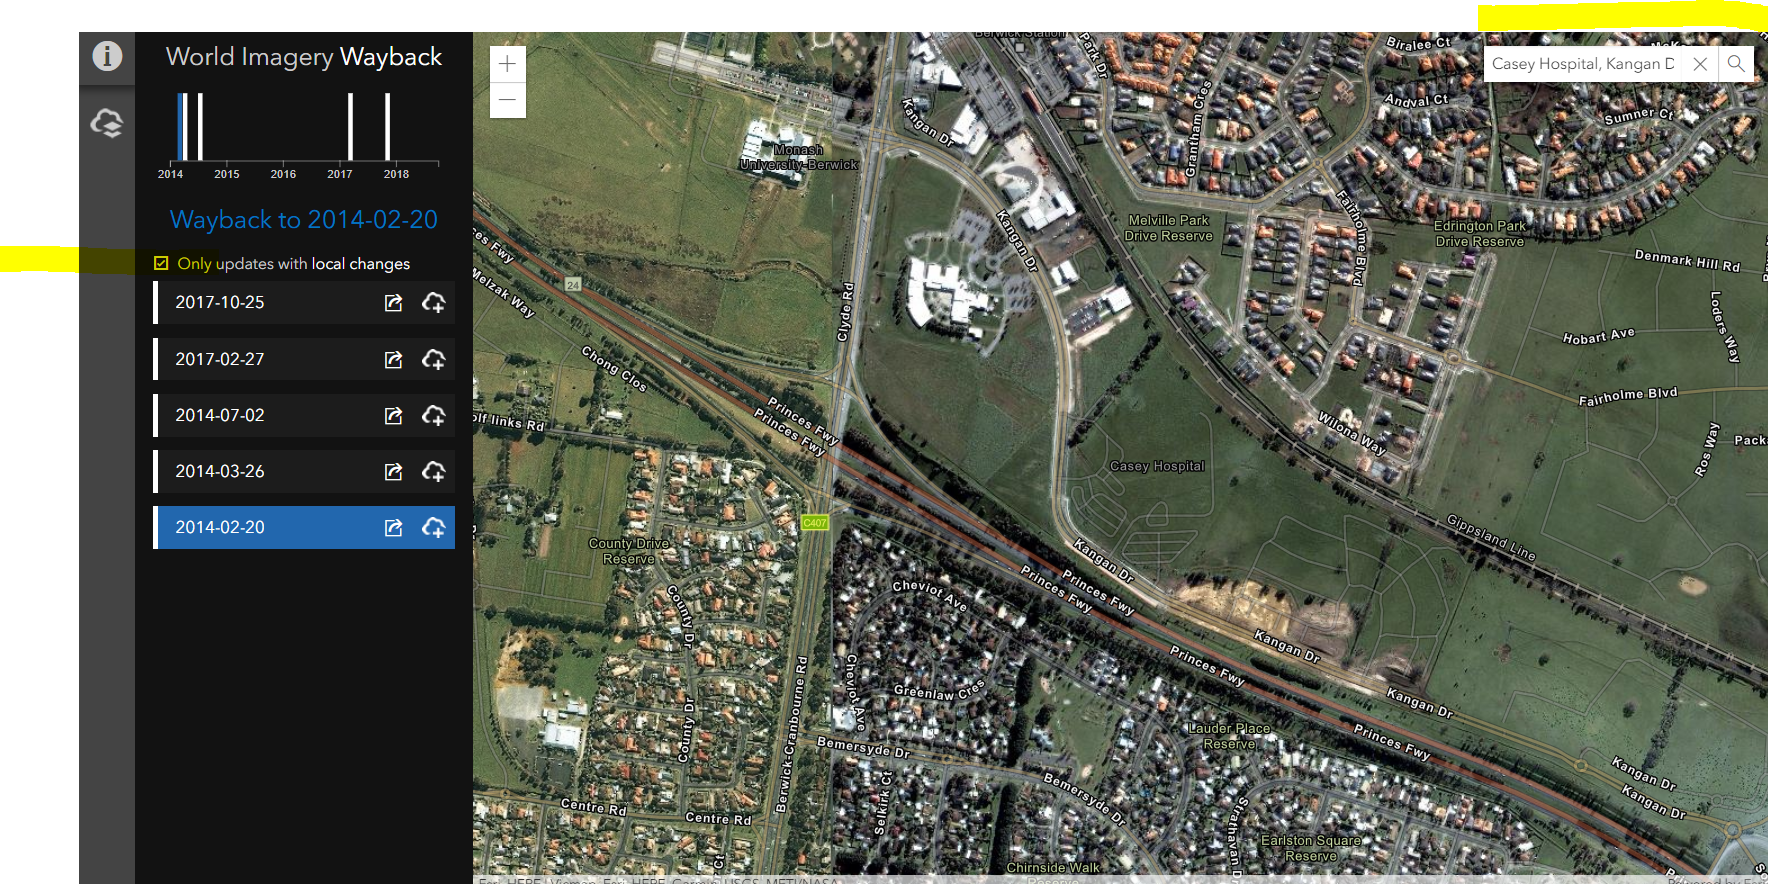
Select different images to the left of the map to display them at right. Did the hospital exist in 2014? Note the hospital’s proximity to the Princes Freeway and to the city of Berwick. Why do you think the hospital chose to locate here?
Zoom out a bit to determine where in Victoria this hospital is and where Berwick is, noting its proximity to Melbourne. You can use the + and – buttons in the upper left of the map, or Shift-Drag Box to zoom in on the box you draw, or Control-Shift-Drag Box to zoom out on that box. Why do you think this area is experiencing urban growth? What do you think it will look like in 10 years?
Examine your own community using the Wayback image service. Examine your own community or even your own school or university campus grounds. What changes can you detect? Why have those changes taken place? What will your own community look like in 10 years? In 50 years? As an example, search for and find Melbourne Grammar School. What changes took place on the southeast corner of one of the fields on the school grounds, on the northwest corner of Bromby and Domain Streets?
However, in keeping with the theme that is important in teaching with GIS of being critical of the data, caution is needed. The dates represent the update of the Esri World Imagery service. This service is fed by multiple sources, private and public, from local and global sources. Thus, the date does not mean that every location that you examine on the image is current as of that date. You may observe construction in your local neighbourhood, for example, but the construction does not appear on the satellite image. Or, you may find imagery that has a wintertime date in the Southern Hemisphere but the leaves were clearly on the trees in the image. The images could have been taken during the summer before, or even from the summer before that. Therefore, as always, know what you are working with. Despite these cautions, the imagery still represents an amazing and useful resource.
Extending the lesson. Note that after you select "only updates with local changes", you have the option of opening those images with changes in ArcGIS . Why would you want to do this? Because if you bring them to ArcGIS , (1) you can add other data to these historical images, such as the OpenStreetMap layer, or layers on land use, hydrology, natural hazards, population change, and more; (2) you can save and share those maps that you create; and (3) you can make story maps and other web mapping applications from the maps.
You must be a registered user to add a comment. If you've already registered, sign in. Otherwise, register and sign in.
-
Administration
90 -
Announcements
88 -
Career & Tech Ed
1 -
Curriculum-Learning Resources
287 -
Education Facilities
24 -
Events
78 -
GeoInquiries
1 -
Higher Education
620 -
Informal Education
286 -
Licensing Best Practices
102 -
National Geographic MapMaker
44 -
Pedagogy and Education Theory
242 -
Schools (K - 12)
282 -
Schools (K-12)
310 -
Spatial data
39 -
STEM
3 -
Students - Higher Education
260 -
Students - K-12 Schools
149 -
Success Stories
45 -
TeacherDesk
1 -
Tech Tips
130
- « Previous
- Next »