- Home
- :
- All Communities
- :
- Industries
- :
- Education
- :
- Education Blog
- :
- Create your own map from field data
Create your own map from field data
- Subscribe to RSS Feed
- Mark as New
- Mark as Read
- Bookmark
- Subscribe
- Printer Friendly Page
Create your own map from field data. To build your own map from field-collected data, you have many options. One way is to use a GPX file from a fitness or GPS app such as the Motion X GPS app.
Creating your own map from field data that has been generated in the field via a smartphone app. Find the GPX file attached to this blog post. Save it to your device. Spatial Technology is able to input and output a wide variety of file types. To help focus attention on file type, make sure that the extensions are made visible in whatever operating system you are using; so that the that file you will work with now looks like the following, with the .gpx extension visible, instead of simply “track_to_picadilly_stn”, but with the full name of the file as follows:

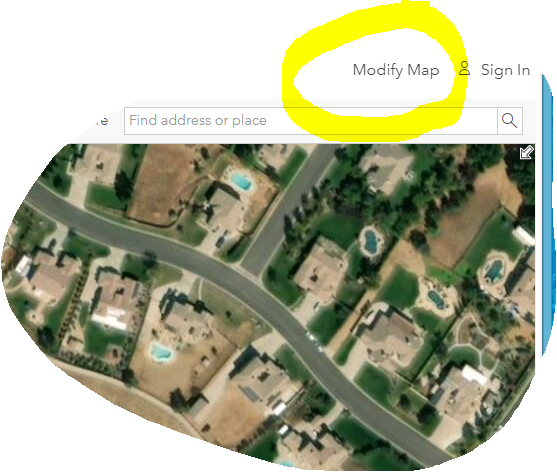
Do not open this file, because you will shortly make a map of this data in ArcGIS . Go to www.arcgis.com > Map > Then, to add a data layer to the map, you will need to select MODIFY MAP to the upper right of the map:
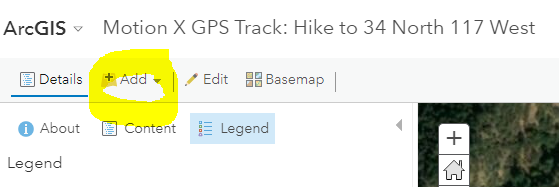
Once you “modify map”, an “Add” button now appears to the upper left of the map, as follows:
Use the Add button > Add Layer from File, as shown below:
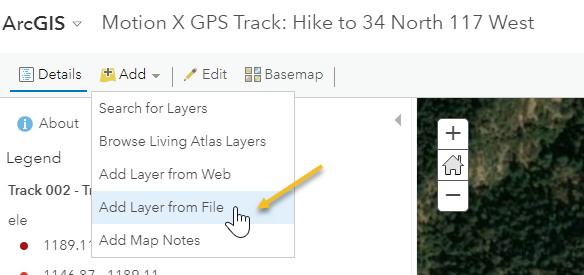
Note the different types of files that you can add from your local device to an ArcGIS map. These types include a GPX file in the list. Navigate on your computer to the folder where you stored your Piccadilly Station GPX file. Select your GPX file to add it to the map.
Once you have added the Piccadilly Station file, it becomes a map layer. The map should zoom to the location of your newly added layer, and your new GPS track should appear in the list of Contents as a layer. If your map is not showing the location of your new GPS track, use the ellipses (…) next to your new layer and > Zoom to Layer. This is the same type of file that you examined for the chaparral hike, but in this case, an actual physical GPS receiver was used instead of a smartphone app.
Change the basemap to imagery if it is not already an image basemap. Notice the vast difference in the land cover here versus that of the California hills chaparral!
Saving your map. Now that you have added data to the map, you can save it into your own ArcGIS organizational account. Use the save tool >  Save your map, naming it “Mapping Field Data” or some other suitable title, and providing tags (such as fieldwork, California, England, GPX) and a description (such as “Mapping Field Data”) so you can easily find it later.
Spatial Thinking, Basemaps, and Bookmarks. If you were using this map in the classroom, consider asking your students to examine clues on the image to determine the type of building that is Piccadilly Station, located at the northeastern end of this walk.
Change the basemap to topographic and zoom out. Consider asking your students: In what city is this walk to Piccadilly Station located?
Use Track to Piccadilly Station > ellipses (…) > “Zoom To” to zoom back to the Piccadilly Track. Use Bookmarks to set a bookmark here named Manchester UK to return to it later. In a similar way, zoom to the Track 002 for the chaparral hills, and to the upper right of your map > Manage Bookmarks > set a bookmark there called “Yucaipa California USA”. Bookmarks are helpful shortcuts to use to navigate in web maps. Use your bookmarks to zoom back to Piccadilly Station.
Change the symbology (style). Using the Contents tool, note that just as with the chaparral data, the data for the Piccadilly Station walk is encoded as a point layer and a line layer. Using your Spatial Technology skills, see if you can determine how to change the symbology (or “style”) for the line to be yellow and the points to be orange. (Hint: Under Change Style > Options > Symbols). Save your map to capture your latest additions and changes.
Assess Data Quality. After you do this, note that the first 4 points in your data table are associated with an elevation much lower than the rest of the data, as shown below:
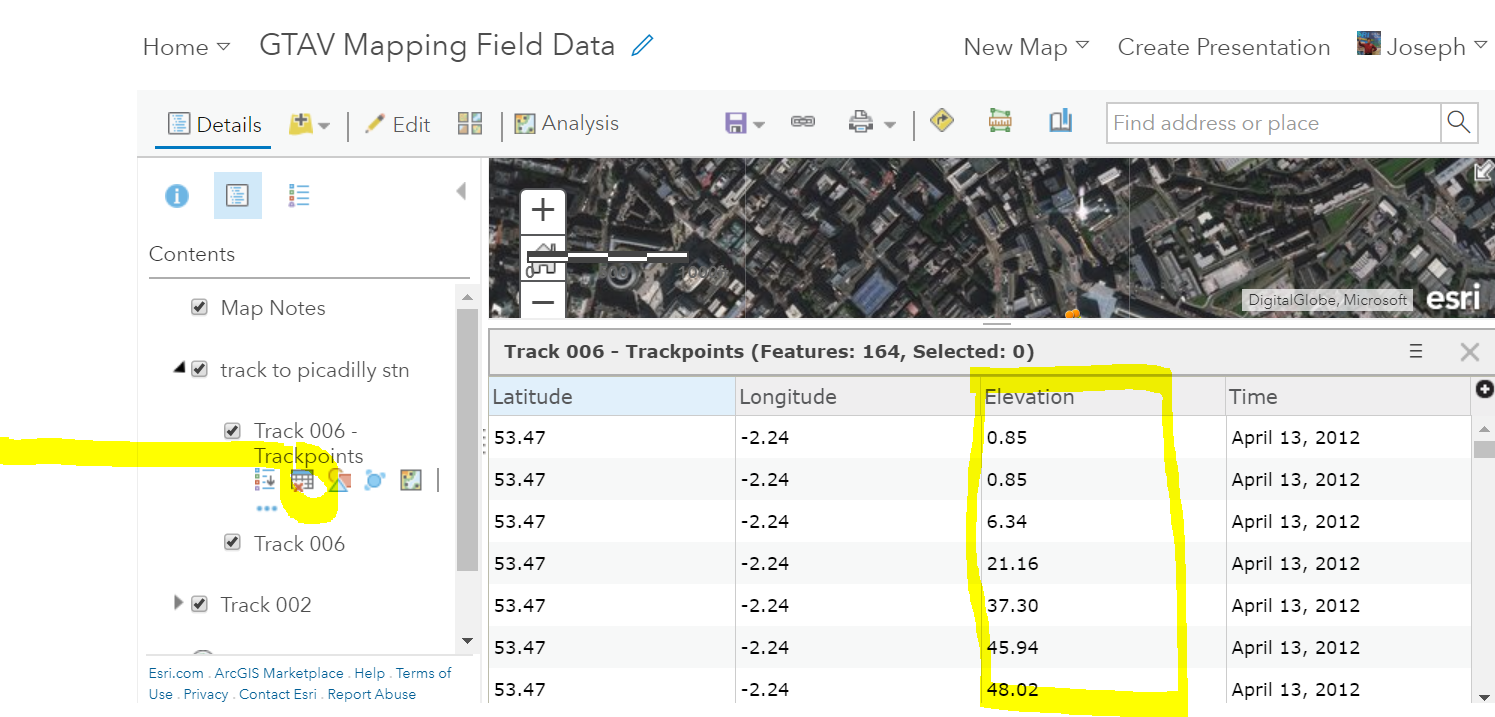
Which elevations are correct--those 5 points that are less than 40 meters, or those 159 points that are just above 40 meters? Change the basemap to topographic. Note that this layer does not provide elevation values. Therefore, you need an elevation data layer to verify your data. Fortunately, the Living Atlas of the World contains hundreds of data layers for your use in education. Remember this resource for your future use of Spatial Technology as it is one of the largest libraries of data and maps in existence.
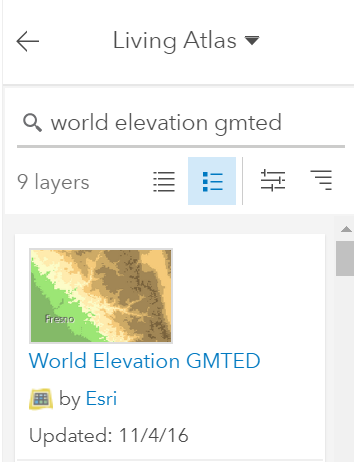
Add data from the Living Atlas. Add an elevation layer as follows: Using the Add Data tool > Browse Living Atlas layers and search for “world elevation gmted” as shown below.
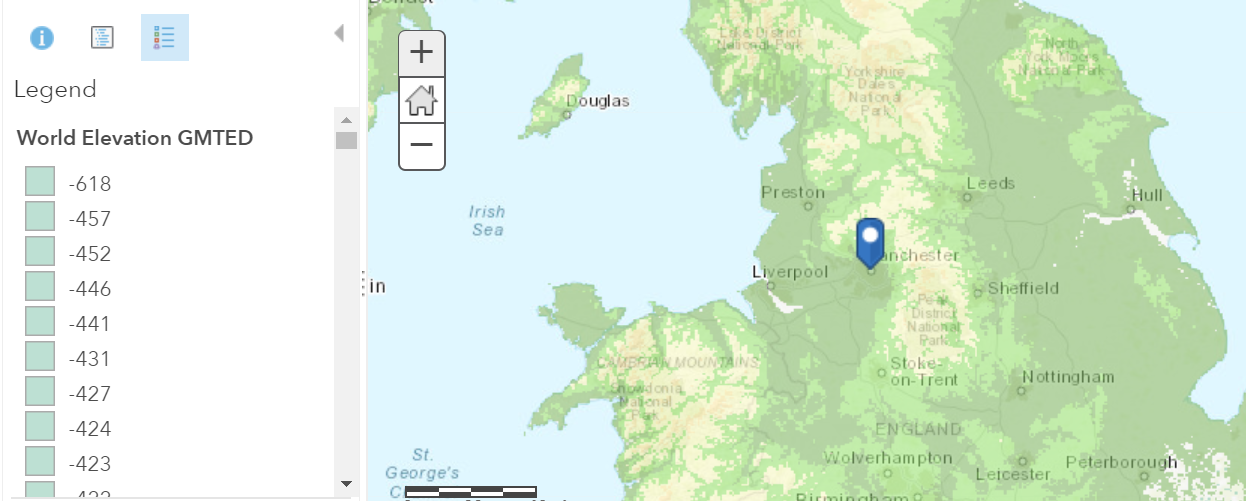
Click on this GMTED layer > Add to Map. Close the appropriate add data panels and return to your Show Contents of Map tab. The data you have just added is the world elevation image service from the Global Multi-resolution Terrain Elevation Data (GMTED) from 2010 with a 250 meter cell size. Use the ellipses (…) to make this layer semi-transparent. Then, zoom out and you will notice that it truly is a global elevation data set with different colours representing different elevations:
Save your map again. This elevation layer might come in very handy for other lessons you are teaching, particularly since it is global in coverage and thus includes Australia.
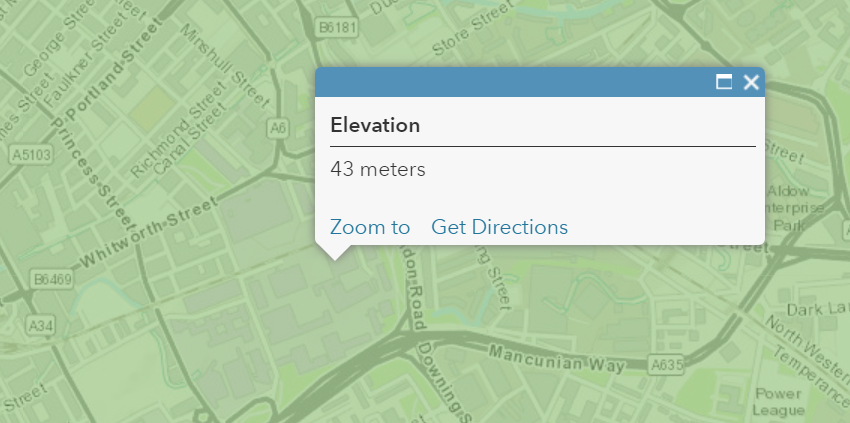
Zoom back to the Piccadilly Station (using Zoom To, to the right of the GPX track, or, using your spiffy new bookmark!). Click on the map to obtain the elevation in a few places. The popup will look similar to that below:
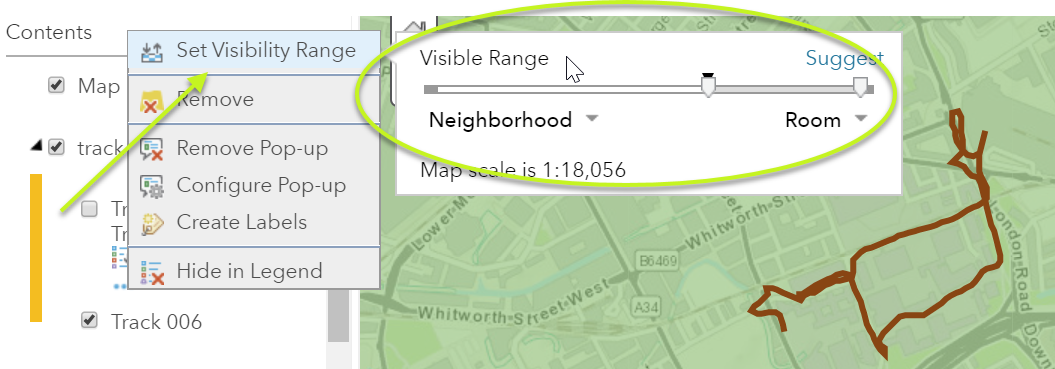
Change the visibility range of your map layer. You may have noted that on this and other layers, the layer may disappear at certain scales. This is a typical part of today’s smart mapping technology and occurs so that your map does not become too cluttered. But you can change this by expanding the map layer in Contents > Ellipses (…) > Set Visibility Range, and expand each end of the range with the slider tools so you see your track at all scales, as follows:
Save your map again. Turn off the elevation data layer.
Verify the elevations using one more source: Open a new tab and open this elevation map of Manchester, here, clicking on a few points in the neighborhood of Piccadilly Station to obtain the elevation: https://routecalculator.co.uk/elevation/Manchester.
Summarizing attribute data quality: Elevation. Using these two sources, you note that the average elevation is around 42 to 48 meters. Now that you have verified that the first few elevations collected in the track were the incorrect ones, consider the location of these first few points. They occurred where the author had just left the building, and as discussed above, this is where the GPS is now free to receive unobstructed signals from the satellites, and therefore, it takes a few seconds to achieve accuracy in the x and y coordinates (longitude and latitude) and up to a few minutes or longer to achieve accuracy in the z coordinate (elevation). That is exactly what occurred here.
During this data quality investigation, you also built additional key Spatial Technology skills, such as examining the table, adding additional data layers including from the Living Atlas of the World, and changing the visible range.
The Living Atlas of the World: A mapping resource. In this activity, you added elevation data from the ArcGIS Living Atlas of the World.
The Living Atlas isn’t the only library of spatial information that exists. But it is worth examining because it (1) is continually curated and updated; (2) it contains authoritative (not perfect, but from authoritative sources) data; (3) it contains thousands of maps and data layers; and (4) the data are in the ArcGIS platform and therefore can be easily mapped.
Other resources for mapped data exists, including the National Map of Australia, the City of Melbourne’s and Victoria’s data portal, and others listed in the Explore Further sections of this component. Your own local governmental authority or university may have spatial data that they are willing to share, so searching those websites using “GIS” and “maps” and “spatial data” as search terms might result in some potential data for you to map.
You must be a registered user to add a comment. If you've already registered, sign in. Otherwise, register and sign in.
-
Administration
90 -
Announcements
88 -
Career & Tech Ed
1 -
Curriculum-Learning Resources
289 -
Education Facilities
24 -
Events
78 -
GeoInquiries
1 -
Higher Education
620 -
Informal Education
286 -
Licensing Best Practices
102 -
National Geographic MapMaker
44 -
Pedagogy and Education Theory
244 -
Schools (K - 12)
282 -
Schools (K-12)
312 -
Spatial data
40 -
STEM
3 -
Students - Higher Education
261 -
Students - K-12 Schools
149 -
Success Stories
45 -
TeacherDesk
1 -
Tech Tips
130
- « Previous
- Next »