- Home
- :
- All Communities
- :
- Industries
- :
- Education
- :
- Education Blog
- :
- Build and map your own data set from a field exper...
Build and map your own data set from a field experience
- Subscribe to RSS Feed
- Mark as New
- Mark as Read
- Bookmark
- Subscribe
- Printer Friendly Page
Build and map your own data set: A field experience. I have written other lessons in GeoNet that you can use to map field data collected by others, but in this lesson, you will have the opportunity to build your own data set.
Let's say you work at a school in Melbourne. You and your students are studying walkability, commuting, and urban spaces. Your students have gone into the field in teams of two. Each team has collected counts of all pedestrians crossing through selected intersections during a 5 minute span of time, and each team has recorded the counts from 0830 to 0835 am and again from 1400 to 1405 (2:00 pm to 2:05pm). Some teams used a clipboard and pencil and some used their smartphone to enter the pedestrian counts. The teams have also collected the latitude and longitude of the location they conducted their observations from. To collect latitude-longitude, those who had smartphones used Motion X GPS or, if they had an iphone, they used the compass tool that is included in iOS, and those without smartphones used a GPS receiver supplied by you, their teacher. You have ensured that each team had at least one student with a smartphone in order to take a photograph of the intersection.
Creating a data table for mapping purposes. Now your students are ready to create a database from which they can map their data and analyse the results. Creating a database is a very important part of GIS, because it is the “I” part—the Information.
Open a plain text editor such as WordPad or NotePad on a Windows device or TextEdit on a Mac device, and enter the following data. Tabular data for Spatial Technology needs to be entered in a precise manner, exactly as shown below. You could copy and paste the data if you would like to, to save time.
Note: If you or your students are familiar with Excel, feel free to use Excel instead of a text editor, naming the fields as specified below. After saving your Excel spreadsheet containing the data, save it again, this time as a CSV (comma separated value) file. You may receive a Microsoft warning saying you will lose some content; but it is OK—CSV is fine for this purpose. CSV is a “bare-bones” spreadsheet format.
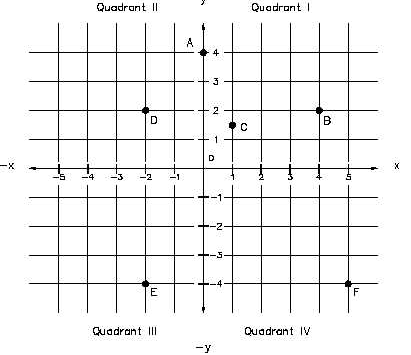
Note key characteristics of the data you will be entering: (1) The data will be in a comma-separated file--all of the data elements are separated by commas. (2) The first line is the header line, that line that describes all of the data that will follow. (3) As it is important to be consistent in the field with measurement times and units, each observation represents the number of pedestrians over a 5 minute time span, with separate fields for the morning and the evening. (4) In a numeric field (integer or floating point), you should not place any letters, such as “degrees C” or “number of people” or “pH”. The reason is because if you want to make graduated color or graduated symbol maps later on a value, that value needs to be a number. Any letters will make your GIS consider that entire field as text instead of a number. (5) Use all of the decimal places given by your GPS receiver or smartphone - no rounding and no truncating! Recall our earlier exercise in mapping points--precision matters! (6) Think about the Cartesian coordinate system discussion: X values in Australia are to the right of Y-axis (the Prime Meridian, and thus in the eastern hemisphere) and are therefore positive, and Y values are below the X-axis (the Equator, and thus in the southern hemisphere) and are therefore negative (that is, in Quadrant III in the diagram below, such as point E).
Three latitude-longitude formats. Three latitude longitude formats exist, and it is important to be able to recognize each. Let us take the Shrine of Remembrance example in Queen Victoria Park in Melbourne.

Shrine of Remembrance, Melbourne, Australia. Photograph by Joseph Kerski.
Decimal Degree: As the name implies, this format (DD) represents locations in the full degree of latitude and longitude and then the fraction of a degree afterward represented by numbers to the right of the decimal point. The above monument in DD is located at -37.830588 Latitude, 144.973363 Longitude.
Degrees Minutes Seconds: As the name implies, this format (DMS) represents locations in whole degrees and minutes, with second often listed with digits to the right of the decimal point for increased precision. Degrees are represented with this symbol (°), minutes with this symbol (') and seconds with this symbol ("). It is important to note that just as with time, DMS is “base 60”. In one degree are 60 minutes. In one minute are 60 seconds. Thus, in one degree are 3600 seconds. The above monument in DMS is located at 37° 49' 50.1" South Latitude, 144° 58' 24.1" East Longitude. With DMS, the cardinal directions are typically given rather than negative values for south and west. DMS is often used in the “EXIF” header files in photographs to indicate the location where the photograph was taken.
Decimal Minutes: This format (DM) represents locations in whole degrees, minutes, and fractions of a minute. The above monument in DM is located at 37° 49.83528’ South Latitude, 144° 58.40178’ East Longitude. As with DMS, with DM, the cardinal directions are typically given rather than negative values for south and west.
As an educator, why pay attention to these three formats? (1) You will encounter and use spatial data in all three formats. For example, DM is often used on geocaching sites. DD is the preferred format for most of Spatial Technology work. (2) For accurate mapping, it is important that the formats not be interchanged or mixed together. For example, 144 58.40178 and 144.973363 are shown DM and DD, respectively, for the same line of longitude, and inputting the DM value into a DD table will place that data point many meters or even kilometers off of its true location. (3) While you can use Excel or websites such as this one from Directions Magazine or this one with a map to convert between the three formats, spending some time discussing and working with each of the formats makes for excellent integration of mathematics. For example, converting DMS to DM uses: Degrees = Degrees, then Minutes.m = Minutes + (Seconds / 60), and converting DM to DD uses: .d = M.m / 60, then Decimal Degrees = Degrees + .d. DD = d + m/60 + s/3600.
Other Formats and Coordinate Systems. Can other methods of recording absolute locations be used? Yes. Street address, city, and postal code could also be used. A more recent system to assign locations to previously un-addressed positions is What 3 Words. Latitude and longitude, street address, and What3Words are examples of absolute location. Street address is a bit more challenging because of the variation in street spellings and format (St Charles St vs Saint Charles Street, or 45 St vs 45th Street, for example), but geocoding is improving with each passing year. Relative location is used frequently in everyday speech but generally cannot be used to determine locations in Spatial Technology. Relative location examples include “left of the library” or “down the hill from the school”.
Another geographic fact that makes working with Spatial Technology a bit more interesting is that some countries use the period and comma in a manner directly opposite to other countries. In France, for example, 26,000 means “twenty-six”, while 26.000 means “twenty-six thousand”. In other countries, a space is often used instead of a comma, such as 26 000 for “twenty-six thousand”. Keep these variations in mind as you seek and map data.
Still another geographic fact that makes working with Spatial Technology a bit more interesting is that there are other coordinate systems in use in different states and in different countries. These include the Universal Transverse Mercator coordinate system (given in meters, northings, and eastings, which you will see later in this component), national coordinates such as the Map Grid of Australia, and state and regional coordinates such as the State Plane Coordinate System in the USA. You will encounter data in these other coordinate systems in the future as you work with Spatial Technology.
Enter data into a table or file. Key in (or better yet, copy and paste) the pedestrian count data below into a text file. Name it melbourne_pedestrians.txt and save it on your computer. If you are using Excel, save it first as melbourne_pedestrians.xlsx and then as melbourne_pedestrians.csv.
Observe that (1) the latitudes are all negative!; (2) the first line contains the field headers, including peds_am (pedestrians for the morning 5 minute period) and peds_pm (pedestrians for the afternoon 5 minute period). (3) your data file cannot have any extra characters or blank lines in it; it must look exactly like this, below:
point, latitude, longitude, peds_am, peds_pm
1, -37.808433, 144.96605, 110, 66
2, -37.819727, 144.969252, 75, 82
3, -37.841688, 144.934744, 19, 12
4, -37.805377, 144.973450, 75, 39
5, -37.814758, 144.961700, 177, 129
Map your table of data. When you are done with your data file, return in your browser to your existing ArcGIS map that contains the hike in the chaparral to 34 North 117 West and the Piccadilly walk that you named “GTAV Mapping Field Data.” Use the Add button and "Add Layer from File". Navigate on your computer to the folder where you stored your melbourne_pedestrians txt or csv file. Select this file and add it to the map. “Smart mapping” will attempt to symbolize your data for you, by your point number, and your map will look similar to the following (change your basemap to the one shown, which is OpenStreetMap).
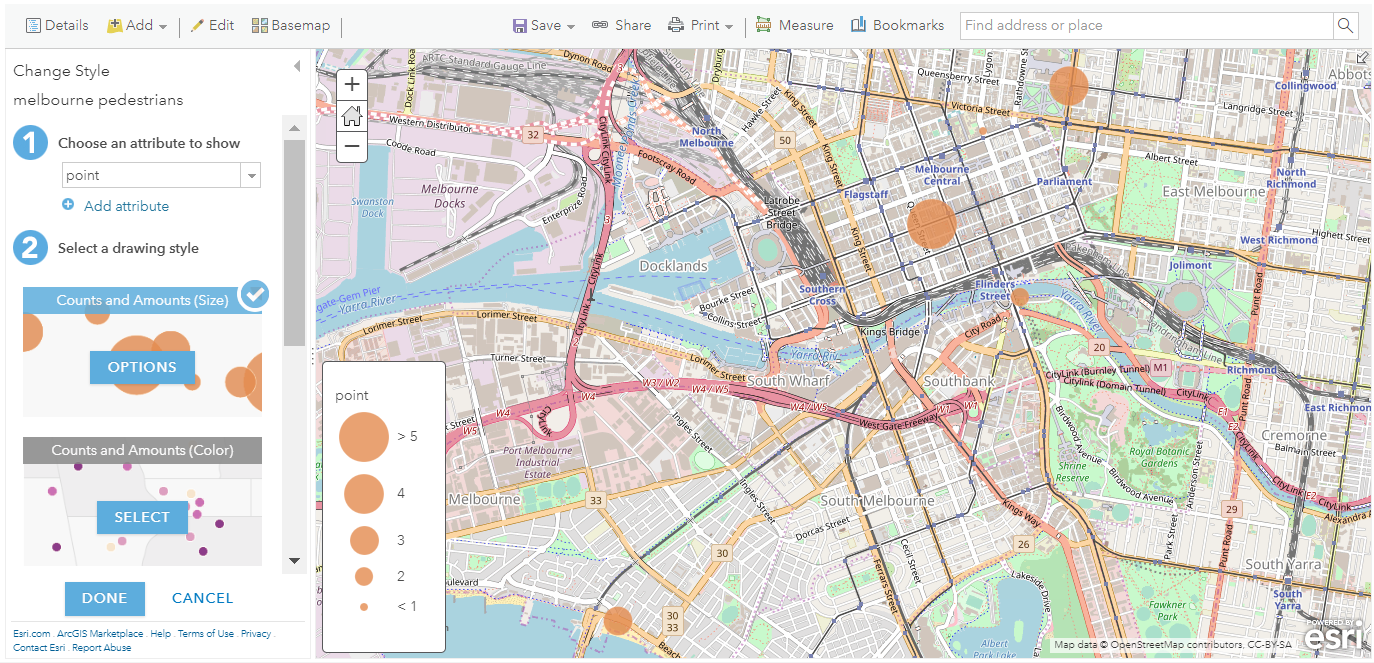
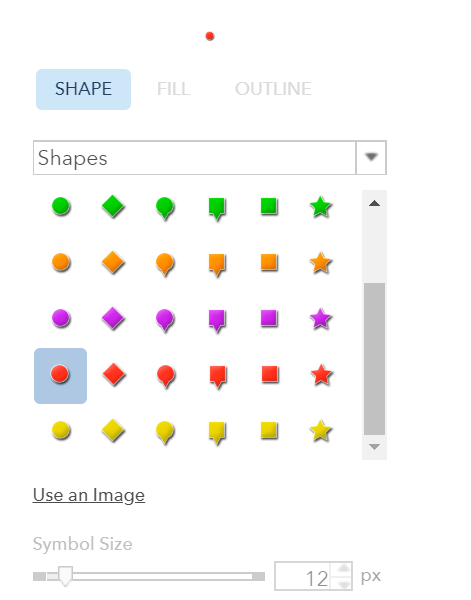
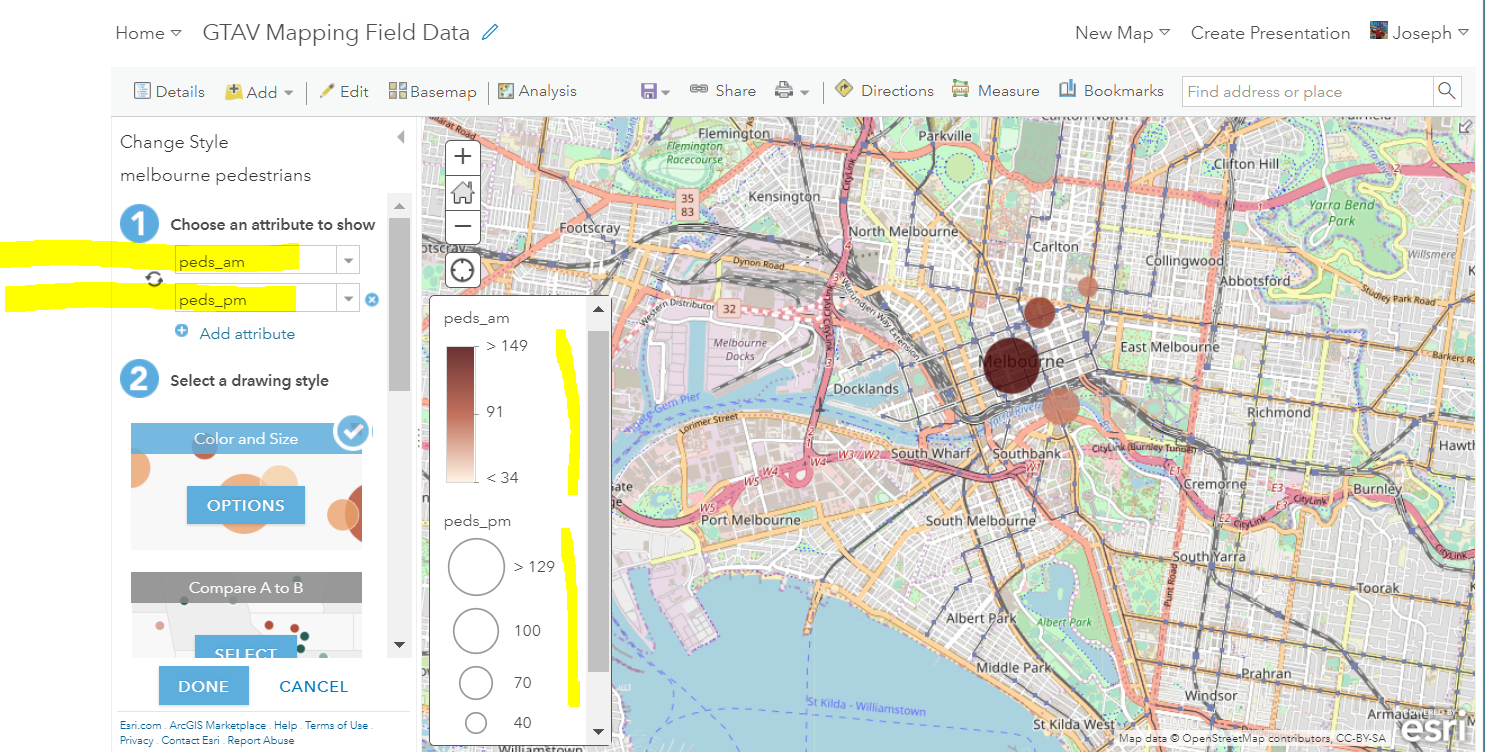
Change the (1) “Choose an attribute to show” from point to peds_am, and (2) change the colour to red or something else, or from a circle to some other symbol, using Counts and Amounts (size) > Symbol, as follows:
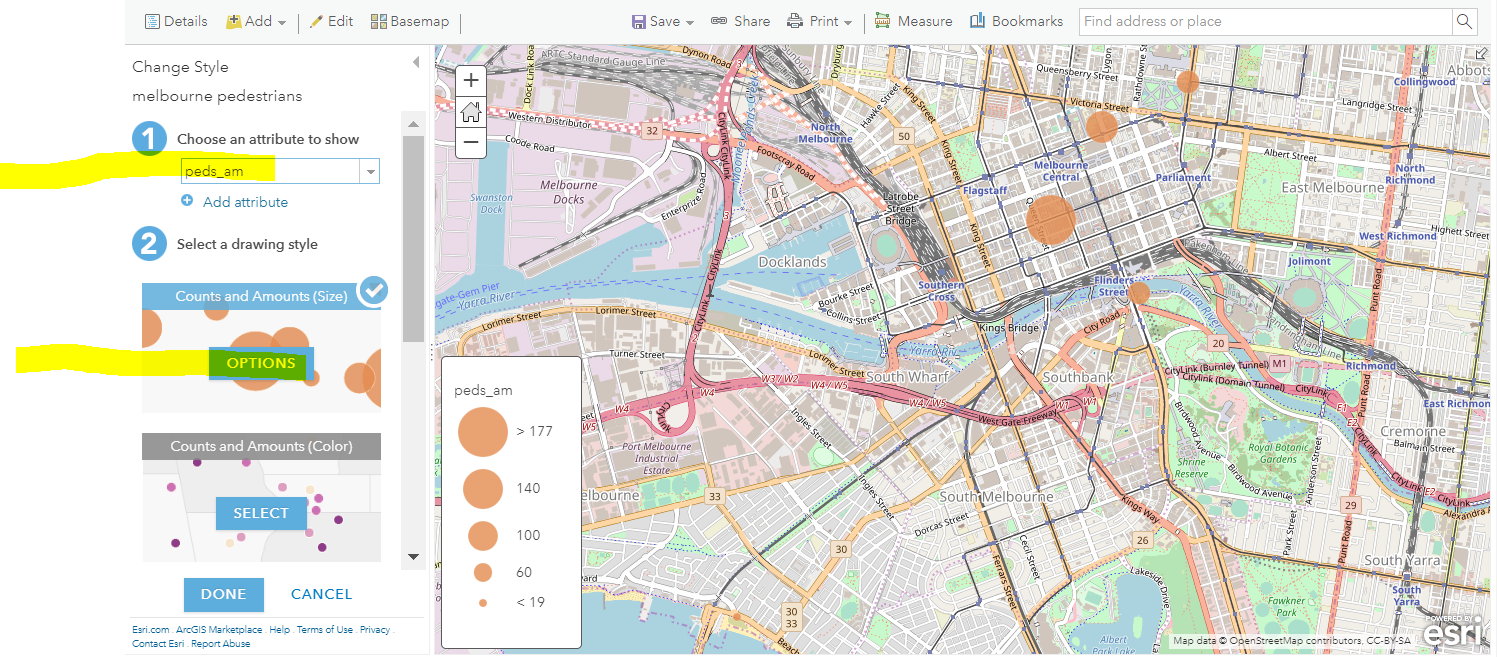
You are now mapping morning pedestrian counts. Go back to your map. What spatial pattern do you notice?
Set a bookmark here  and name it Melbourne City Centre Australia or something similar. Click on a few points on your map. Do you see the pedestrian data that you have entered for each point appearing as popups? Note for your future use of Spatial Technology that the content of these popups can be modified. Save your map again.
Now you are ready to tap into some of the true power of GIS—mapping two variables, and building expressions.
Map two variables. Because your students went into the field twice and collected data during the morning commute hour and during the time between lunchtime and the afternoon commute, let’s say you wanted to compare the two values.
First, use Change Style underneath your Melbourne pedestrians layer. Second, use Add Attribute > add the peds_pm value as an additional attribute to map > Done. Your map changes so that the colour of the circle represents the morning pedestrians, with darker indicating more, and the size of the circle indicates the afternoon pedestrians, with larger sizes indicating more afternoon commuters. Knowing this, reflect on what a large dark-coloured circle would indicate vs. a large light-coloured circle.
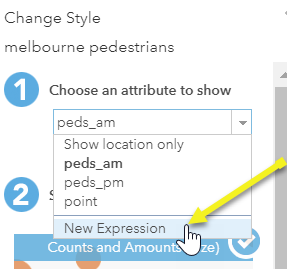
Use an expression for further analysis. Second, you can use expressions in Spatial Technologies, as you have already seen in your use of filtering earlier in this module. Here, use an expression to analyse the difference in morning versus afternoon, specifically, dividing the morning count by the afternoon count. Do this as follows: Change Style > Under (1) choose an attribute to show, select “New Expression” as follows:
In the dialog box for New Expression, click on feature “peds_am”, then enter / for the divide arithmetic operator, then click on feature “peds_pm”, so that your expression looks like that shown below. Your expression will be built as you click on variable names; that is, you should not have to key in anything except for the / operator. Once the expression is built, select OK in the lower right:
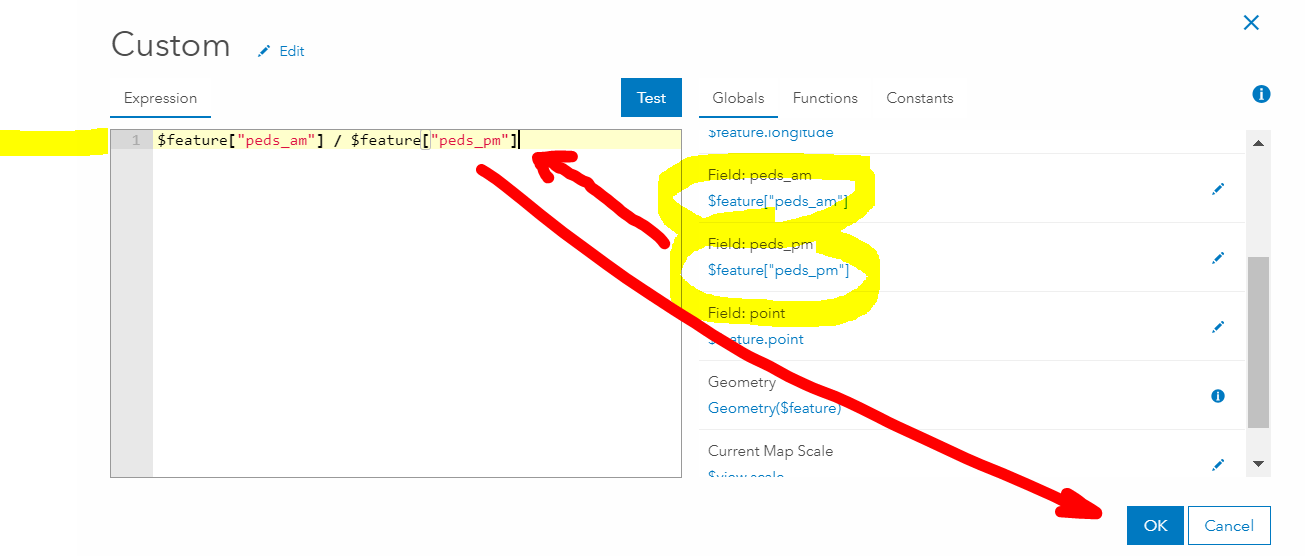
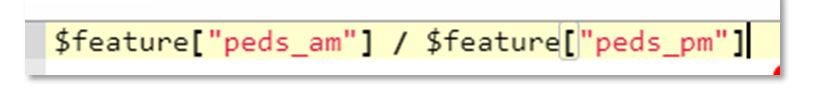
Your expression should look like this:
Save your map again. Note the new patterns on your map. The point near the river is barely visible (you can adjust the size of the points using Change Style) because the afternoon count was more than the morning count, and therefore, the ratio was less than 1. Conversely the northeasternmost point is the largest because the morning count there was nearly two times higher than the afternoon count.
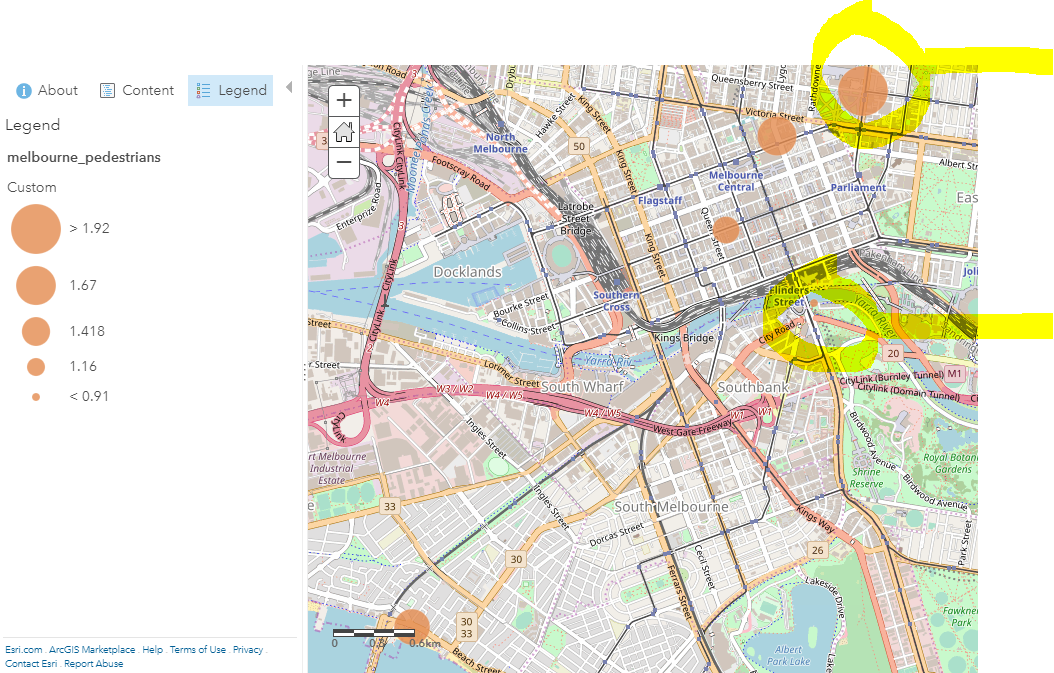
You conclude that the northeastern part of the city centre seems to have proportionally higher pedestrian traffic in the morning than in the lower commute time of mid-afternoon, but that you need more points. You decide to revisit the existing sites to gather additional data and also to gather data at new sites. Save your map again.
Reflecting on the skills you have gained. Reflect for a moment on the Spatial Technology skills you just gained. Now you know how easy it is to add your own data from a spreadsheet, map it, and start analyzing it. You also learned how to map more than one variable at a time, and you learned how to add an expression. These expressions, called Arcade Expressions, can be used on any data, provide connections with mathematics education, and extend the power of Spatial Technology. Think about using it to compare two population counts, or food cost eaten at home vs. away from home, or earthquakes by size and magnitude, for example.
You must be a registered user to add a comment. If you've already registered, sign in. Otherwise, register and sign in.
-
Administration
89 -
Announcements
85 -
Career & Tech Ed
1 -
Curriculum-Learning Resources
280 -
Education Facilities
24 -
Events
77 -
GeoInquiries
1 -
Higher Education
616 -
Informal Education
284 -
Licensing Best Practices
102 -
National Geographic MapMaker
39 -
Pedagogy and Education Theory
239 -
Schools (K - 12)
282 -
Schools (K-12)
302 -
Spatial data
39 -
STEM
3 -
Students - Higher Education
257 -
Students - K-12 Schools
142 -
Success Stories
44 -
TeacherDesk
1 -
Tech Tips
125
- « Previous
- Next »