- Home
- :
- All Communities
- :
- Products
- :
- Data Management
- :
- Data Management Questions
- :
- Re: GDBT to ArcGIS 10.1?
- Subscribe to RSS Feed
- Mark Topic as New
- Mark Topic as Read
- Float this Topic for Current User
- Bookmark
- Subscribe
- Mute
- Printer Friendly Page
GDBT to ArcGIS 10.1?
- Mark as New
- Bookmark
- Subscribe
- Mute
- Subscribe to RSS Feed
- Permalink
Thanks,
CSQ
- Mark as New
- Bookmark
- Subscribe
- Mute
- Subscribe to RSS Feed
- Permalink
Pretty much says it...
Needs to be part of core.
- Mark as New
- Bookmark
- Subscribe
- Mute
- Subscribe to RSS Feed
- Permalink
Hey Derek, glad to hear from you and the UC sounded like it went really, really well. I appreciate your and now also Asrujit's workarounds, but here's the thing: I work in an agency which primarily does GIS work in a citrix environment.
As you might have guessed, we have no access to install workarounds on agency blades in a remote datacenter. As for those of us who have installed arcgis on a local machine, getting access to edit registry settings is, well, not common. Sorry to say, if it takes this many workarounds, it's just not going to happen. If there's anything that could be done that doesn't require so many workarounds - like an install file, that would be simplest, wouldn't it?
Simplistic as ever,
Clara
- Mark as New
- Bookmark
- Subscribe
- Mute
- Subscribe to RSS Feed
- Permalink
Hey thanks Derek Law I know you're onto other things besides ArcSDE, but I checked ArcGIS Ideas (your post above), and found 6 separate threads there related to the versioning state lineage tree diagram, and can't even find (in the new system) my own forum responses to ESRI's question about how we use the GDBT. I had posted those responses in the past on request.
Here's my point: all of our feedback and requests are scattered all over the place, resulting in the appearance that this is coming from a half dozen fringe users. I was at the noontime meeting at the UC several years ago when the ESRI development panel was very clear that it was not interested in supporting the state tree diagram, and I can tell you there were more than a half dozen people in the room.
Can you or someone on the ESRI end with any interest in the GDBT and state tree diagram Asrujit SenGupta help us consolidate that feedback into one place so that our request can be viewed as one request and given its fair weight?
Thanks, Clara
- Mark as New
- Bookmark
- Subscribe
- Mute
- Subscribe to RSS Feed
- Permalink
Hi Clara,
> ... all of our feedback and requests are scattered all over the place, resulting in the appearance that this is coming from a half dozen fringe users. ... Can you or someone on the ESRI end with any interest in the GDBT and state tree diagram help us consolidate that feedback into one place so that our request can be viewed as one request and given its fair weight?
I just checked the Ideas site and I see your point. Yes, I will coordinate getting the various separate ideas integrated into a single/unified idea - to more accurately reflect the user interest in the state tree viewer functionality.
I will update this thread when this has been done.
Thanks.
- Mark as New
- Bookmark
- Subscribe
- Mute
- Subscribe to RSS Feed
- Permalink
Hi Clara,
FYI, we've aggregated the GDBT-related ideas on the Ideas site into a single idea and marked it as implemented.
Release the GDBT for ArcGIS 10
With the exception of the State Tree viewer functionality, which had 2 separate ideas posted; which have now been combined into a single idea,
State Tree Diagram for 10.1 and above
Thanks for bringing this to my attention.
- Mark as New
- Bookmark
- Subscribe
- Mute
- Subscribe to RSS Feed
- Permalink
Hey Derek, that's awesome, I thank you for taking the time. A chance for a fair hearing is the main thing I've been wanting to see. Now, the ball is in our court, right? Chris Quick Brian Oevermann Paul Medley Tim Dine Joshua Bixby.
Thank you for your help, Derek
- Mark as New
- Bookmark
- Subscribe
- Mute
- Subscribe to RSS Feed
- Permalink
I think the ball is still in Esri's court. The community of users has already done its part by creating enhancement requests, logging ideas, and promoting those ideas. The community has played by the rules laid out by Esri, now it is their turn to make a decision one way or the other.
- Mark as New
- Bookmark
- Subscribe
- Mute
- Subscribe to RSS Feed
- Permalink
Hey yeah, I have posted and answered the question of how I use the GDBT and why I care about the versioning lineage diagram many times and in several places, so I very much understand the sentiment, but the request is all in one place now, and was not before this.
Derek spent the time to do that for us, which I appreciate, so I will at least try this venue, and a positive vote will only take a second. If we have better options, I'm all ears, give me a call?
- Mark as New
- Bookmark
- Subscribe
- Mute
- Subscribe to RSS Feed
- Permalink
I am going to try to embed a JSFiddle frame here, not sure it will work so I might be deleting this comment later. Embedding the frame didn't work, updating with link to JSFiddle instead.
Better options? Well, I can't say it is very refined, or at least not yet, but one could use JavaScript to create an SDE state tree in a browser: SDE State Tree Example - JSFiddle.
A couple of comments:
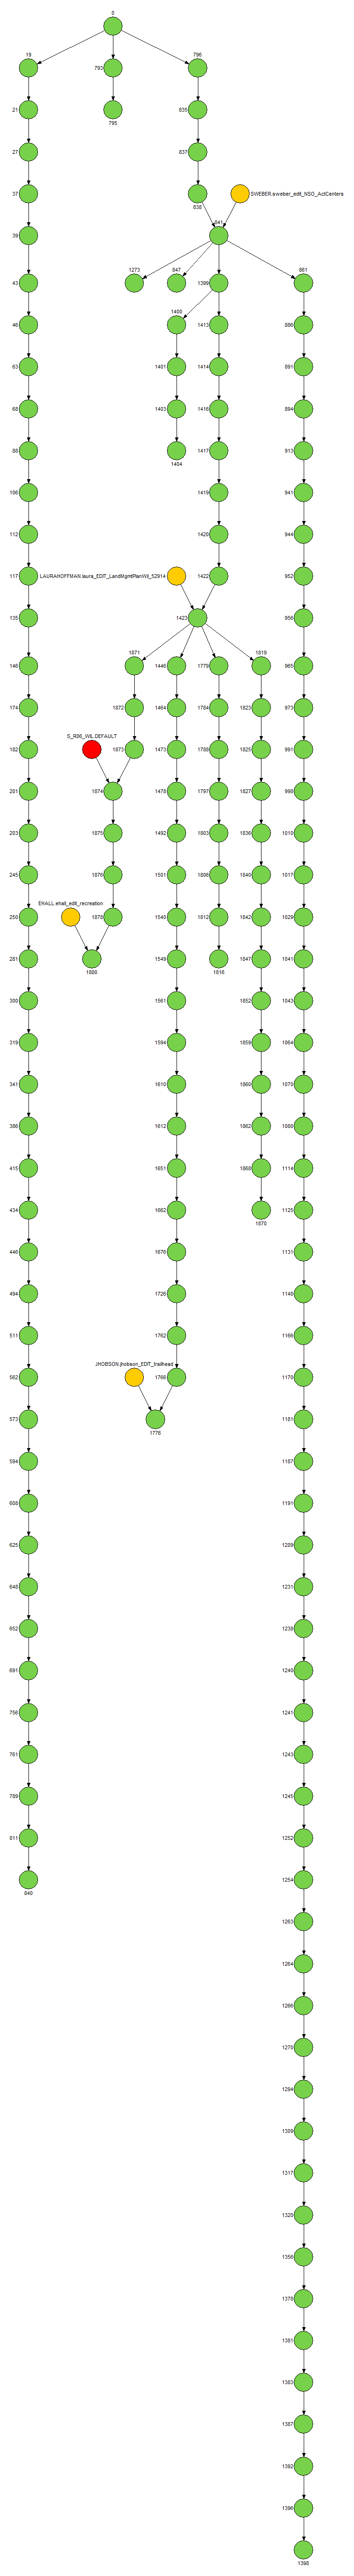
- The JSFiddle example above relies on 2 open-source JS libraries. Papa Parse is used to parse a CSV file created by running SQL to query the current state of an SDE geodatabase, and vis.js is used to visualize that information as a hierarchical network.
- The state tree diagram is similar, but not identical, to what is generated by the GDBT (see attachment).
- The default settings for the hierarchical repulsion solver used by vis.js allow branches to sway a bit, i.e., the entire branch isn't perfectly vertical.
- The tree layout is based on hubsize and not state/node order, i.e., the top node isn't State 0 but the state that has the most branches.
- The diagram has been enhanced with more colors.
- State 0 is Blue.
- Versions tied to replicas are Orange.
I must admit, I am a complete hack when in comes to JS, which is why I am convinced that Esri really isn't interested in providing this functionality. If a novice with 2 open-source JS libraries and half of day of free time can get a state tree diagram that is in the ballpark, how hard can it be for a professional developer to bang out this functionality in some way, shape, or form.
- Mark as New
- Bookmark
- Subscribe
- Mute
- Subscribe to RSS Feed
- Permalink
Wow, thanks for taking a stab at that! I'm not at all distracted by swaying branches, we're all tree people in my line of work, which includes swaying branches, eh? It took me a minute to get the hang of it (lineages pointing upwards, for example) but it totally works for me, once I got over that.
I noticed another difference: at state 1871 in your example, the sync replica is showing. With all these use of 'create local copy of a feature service for editing' we need more ways to keep track of what is happening with versions and replicas. Thanks again for taking the time to do this!