Understanding Your Results with the Analyze Tab

3711
13
09-13-2016 05:21 PM
JamesTedrick
Esri Esteemed Contributor
3 13 3,711

You've collected your data using Survey123 for ArcGIS, what's next? There are several ways the Survey123 website can help you analyze and visualize the results of your survey.  The Analyze tab enables some great reporting capabilities that help you review, understand, and interpret your survey results. It provides some simple, but very powerful reporting tools such as making charts, word clouds, etc. These tools can help you better interpret your survey results.

Viewing Results - The Analyze tab

At the Analyze tab of a survey, you can view the aggregate results of your survey- each question, aside from image questions, will display a chart. Depending on the data type, the charts available will be different:

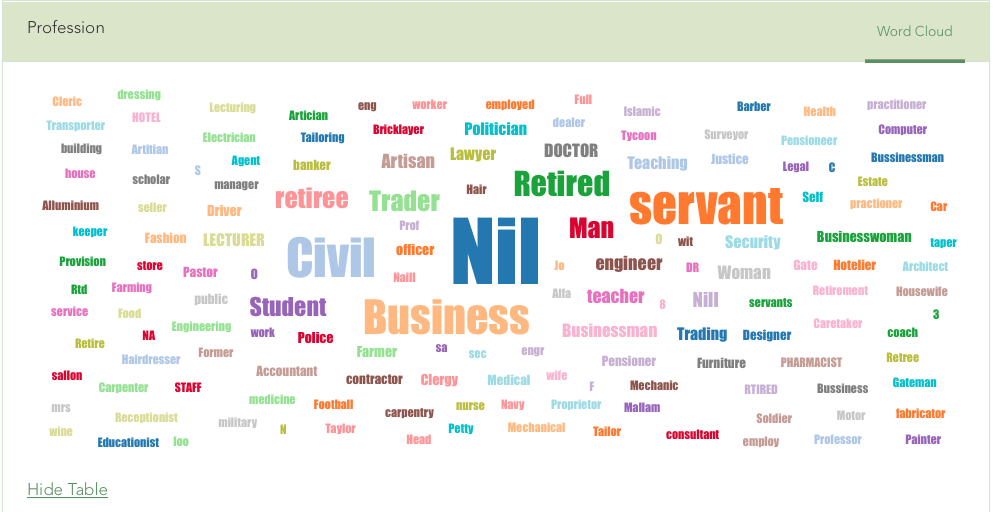
  • Text (free text): The most common words by count will be displayed as a word cloud (requires at least 20 entries)
    Word cloud visualization of a text field
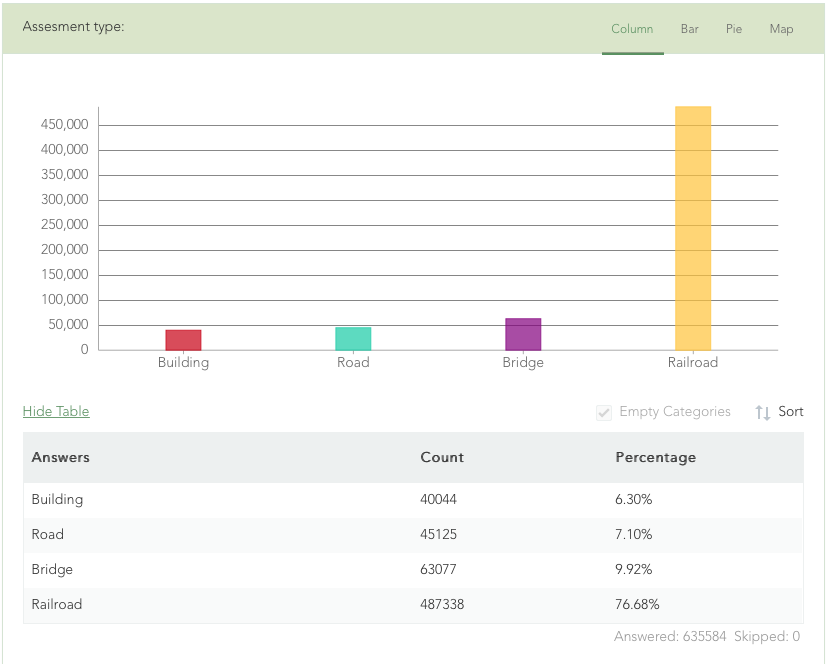
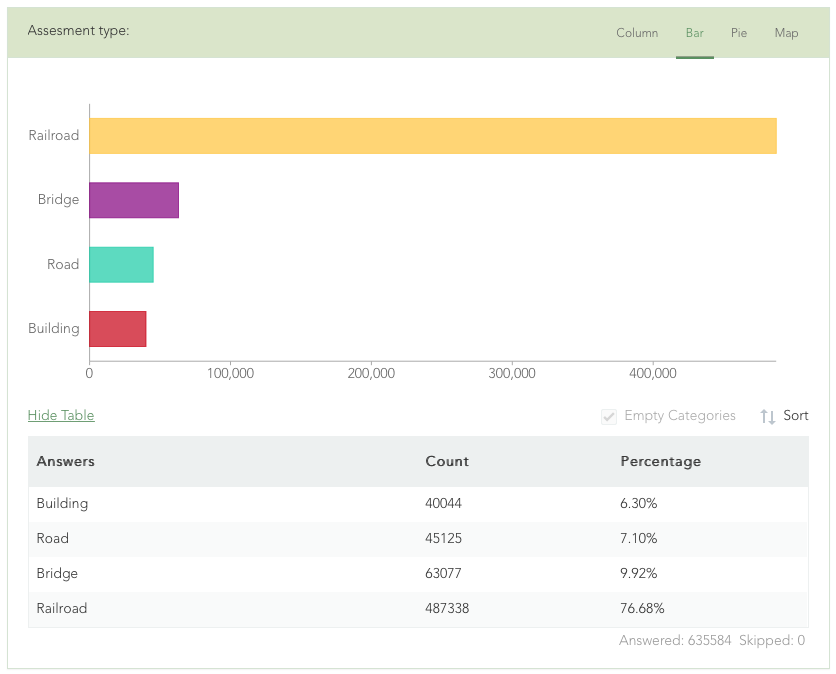
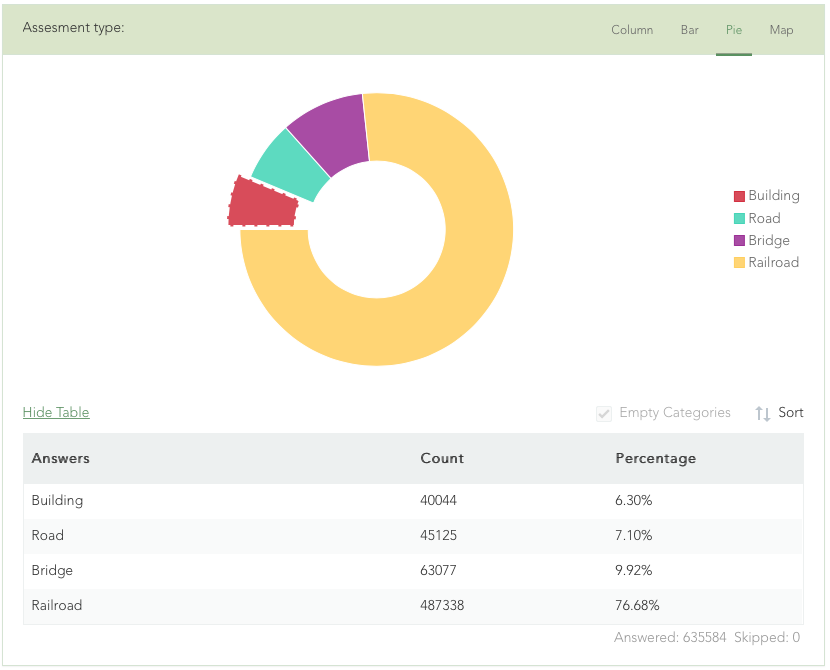
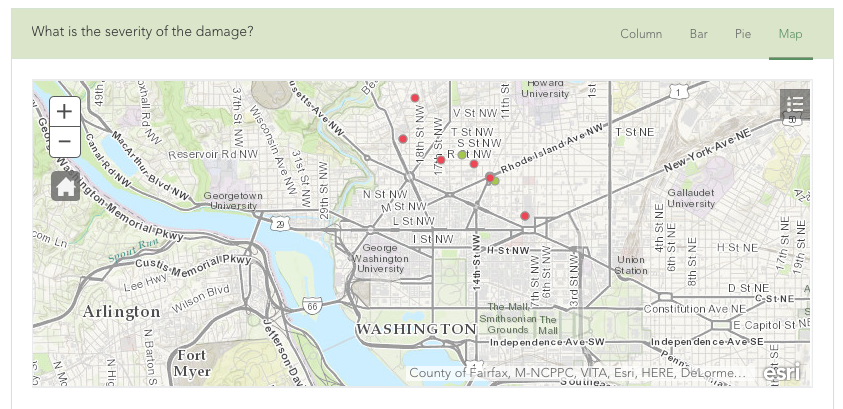
  • Single Choice Questions: Column, Bar, and Pie charts, as well as a map color-coded by answer
    Column chart visualiztionBar chart visualizationPie chart visualizationMap of points categorized by field being visualized
  • Multiple Choice Questions: Column, Bar
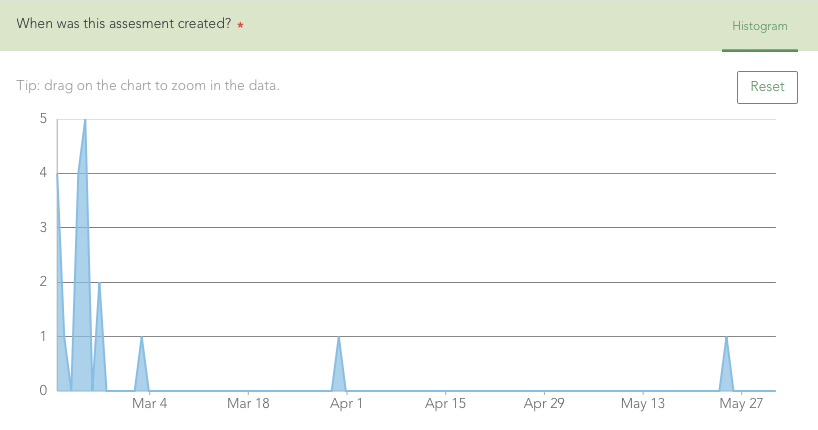
  • Date questions: Histogram
    Histogram visualization of date field

PrintingCharts can be printed as displayed; this also allows for PDF export on many computers

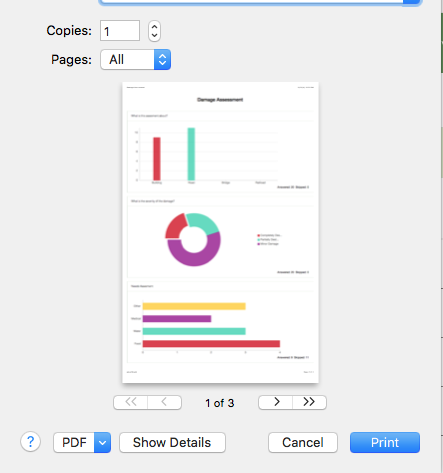
From the Analyze tab, you can print your entire survey summary results as a PDF file. You can alternatively hide questions from your report using the 'Visibility' setting. When ready to print, use the 'Print Current View'; if your browser supports PDF generation, you can then save the result to a PDF file.

With the latest update to the Survey123 website we also have enabled the printing of individual responses. In the 'Data' tab is now the option to view the details of a response. From there you can print that detail or save as a PDF file.

What will we improve?
Looking forward, an area we are working on is providing additional capabilities to filter survey data totals to be able to see statistics based on the values of questions or submission time. We also want to support bulk printing of records.

We also want  to enable you to share  the survey results with groups of people. At the moment, only the owner of the survey can look at the analyze tab.

Try out the Analyze tab, Detail view, and printing and let us know what you think!

Tags (1)
13 Comments
FinnianO_Connor
Occasional Contributor II

Currently some types of fields are not available through the Analyze tab (note and read-only are mentioned). I have calculated fields that also are not visible, should this be the case? It would be good to have them available on the Analyze tab together with the ability to include them in the printed report.

Finnian

Lynchburg_GISDivision
New Contributor III

Only one question from my survey is showing in the Analyze tab.  The other questions that I wish to analyze are either text or single choice answers.  This has not been an issue with other surveys I've created.  Any ideas or suggestions?

JamesTedrick
Esri Esteemed Contributor

Hi there,

Have you shared the survey for analysis?  If so, can you verify that the 'stakeholder' view has the fields visible?

ZhifangWang
Esri Regular Contributor

Hi Finnian,

Answers to read-only questions will show up on the Analyze page in 2.1 release, which planned in late May/early June.

  • Note: only read-only question with calculation set will show up on the Analyze page due to read-only question without a calculation will not generate a field in the behind feature service


Thanks again for your feedback!

MikeOnzay
Occasional Contributor III

Is there any way to hide the download button in the data tab? If I'm going to share this survey with a large group of people in my organization the last thing I want to do is give them the ability to download the data.

On one of my graphs the title is offset for some reason from the background header. No other graph is affected. I'm viewing this in Chrome.

title offset from background header

Is there a way for me, as the survey owner, to set the data page to not show the map for others when all of the points are off of Africa? I would rather just show the expanded table.

Is there a way for me to hide the word cloud for others? I know that I can hide it for myself through the set visibility. The word cloud is being applied to a field that is an ID and it is going to have more than 500 unique values. It really should not be applied here at all.

Finally, it was unclear to me at first how I was supposed to share these results with others in my organization. After setting collaborate (analyze) to my organization. I thought sending them a link to the survey would work. When I tested it with another person it wanted to download the field app to their computer. That is not what I expected or want it to do. I want it to open the web page because that is where the graphs are located.

By sharing the results with My Organization should anyone be able to find this in my organization's gallery?

The instructions should state that to share with others they need to sign in to survey123.arcgis.com and choose "surveys shared with me"

JamesTedrick
Esri Esteemed Contributor

Hi Mike,

- Hiding of the Download button: This can be disabled via the item details in ArcGIS Online.  Go to My Content, open the Item Details for the Stakeholder view and click on the Settings tab.  Uncheck the 'Allow others to export to different formats' option.

- On the title being offset - I noticed that it's also coming in with a blue font color- are you using HTML in the questions?

- There currently isn't a way to show only the table by default

- We currently don't have settings to hide questions.  That being said, you could remove those fields from the stakeholder view (what is shared to others) by altering the stakeholder view's field settings - see Manage hosted feature layers—ArcGIS Online Help | ArcGIS .  This is useful only when the question does not need to be viewed in the data tab as well.

- After the survey has been shared, simply have the people whom have been shared the survey log on to https://survey123.arcgis.com .  They will see the survey in the gallery when the select the 'Surveys shared with me' in dropdown at the top left of the gallery:

The analyze page doesn't exist as a separate web application, so it won't appear as an item in ArcGIS Online.  We will be working on an option 'Open in Survey123 website' for the item details in ArcGIS Online in the future.

James

MikeOnzay
Occasional Contributor III

James,

The stakeholder was something new. I did not notice it before but now I see how it is a view

Yes, I am using HTML <center><H2><font color="blue">Structure Type</font></H2></center>

Thanks for the other explanations.

JamesTedrick
Esri Esteemed Contributor

Hi Mike,

On the text formatting - it's most likely that the H2 formatting of the website is being applied to your question title and that's causing the shift in placement.

Lynchburg_GISDivision
New Contributor III

The issue was with nested groups.  Once I removed the nested groups, everything was working properly.

ZhifangWang
Esri Regular Contributor

Hi LynchburgGIS

It is currently a known issue that the Analyze page and individual response view in the Data page cannot work properly if there's nested group or repeat section in the survey. 

Thanks.

ZhifangWang
Esri Regular Contributor

Hi Lynchburg,
Just want to let you know that things have been moving forward, nested repeats/groups will be supported in individual response in 2.4 release and supported in Analyze page in 2.5 release.

DerekKonofalski
Occasional Contributor

Sorry for resurrecting this but I couldn't find any info on the Analyze tab outside of this post. Is it possible to customize the colors used for the charts on this screen? We sent out some surveys where the answers are "Yes", "No", and "Pending" and the "Yes" is red, the "No" is green, and "Pending" is purple. It seems like it makes better sense for people looking at these to see green, red, and yellow, respectively, so it would be nice if that's possible.

anonymous55
Occasional Contributor II

Hello 

I shared Analyze page with some users but we can't see some fields? 
and shows this.
ARM_0-1644267986089.jpeg

What is of meaning of this?
I didn't find anything about those dot in green area. 

About the Author
I work on the Survey123 team. Please note that I do not use the private messages feature in Esri Community; if you need to reach me, feel free to e-mail jtedrick@esri.com .