- Home
- :
- All Communities
- :
- Products
- :
- ArcGIS Pro
- :
- ArcGIS Pro Questions
- :
- Re: Tabulated Area Gives Results that don't make s...
- Subscribe to RSS Feed
- Mark Topic as New
- Mark Topic as Read
- Float this Topic for Current User
- Bookmark
- Subscribe
- Mute
- Printer Friendly Page
Tabulated Area Gives Results that don't make sense
- Mark as New
- Bookmark
- Subscribe
- Mute
- Subscribe to RSS Feed
- Permalink
I am using tabulate area in Spatial Analyst Tools to calculate the percentage of different land types in each CONUS state. But the final results does not make sense. For example the percent "CULTIVATED CROPS" land types are much lower than expected and even the ranks do not make sense!! For example highest cultivated crops is over 26% for Florida! While Iowa is number 29 with only 1.27% crops land, or Nebraska 36 with 0.77%!!
I simply added all land type values from Tabulate Areas and then divided CROPS_LAND by total!
So here is the process:
I'm using ArcGIS Pro 2.7.0 .
* Feature zone is a vector layer containing state boundaries of CONUS from TIGER/Line Shapefiles of Census Bureau
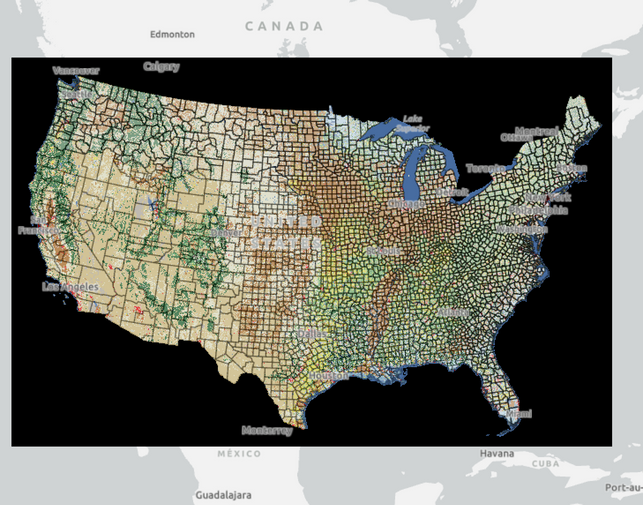
* The raster layer is the National LandCover Database (NLCD 2016) which is an .img file with 30mx30m land types over CONUS. (over 1 GB file size)
here is a picture of them
(projection for the map is NAD 1983 ContiguousUSA Albers.)
Tabulate area completes without error (Although takes a lot of time each time and the following table is resulted (with 49 rows of values for states in CONUS and the District of Columbia):
| NAME | UNCLASSIFIED | A_ | OPEN_WATER | PERENNIAL_SNOW_ICE | DEVELOPED__OPEN_SPACE | DEVELOPED__LOW_INTENSITY | DEVELOPED__MEDIUM_INTENSITY | DEVELOPED__HIGH_INTENSITY | BARREN_LAND | DECIDUOUS_FOREST | EVERGREEN_FOREST | MIXED_FOREST | SHRUB_SCRUB | HERBACEUOUS | HAY_PASTURE | CULTIVATED_CROPS | WOODY_WETLANDS |
So I add all values in columns from OPEN_WATER to WOODY_WETLANDS to calculate the total. Then do CULTIVATED_CROPS/total.
I am really confused and don't know what I am missing here.
I would appreciate your helps and suggestions.
- Mark as New
- Bookmark
- Subscribe
- Mute
- Subscribe to RSS Feed
- Permalink
Please ensure both the Raster layer and Feature Zone layer have same Projected Coordinate System (say NAD 1983 Contiguous USA Albers).
Think Location
- Mark as New
- Bookmark
- Subscribe
- Mute
- Subscribe to RSS Feed
- Permalink
Thank you very much. But I have both in the same map, and isn't it that everything added to the same map will automatically adapt the same Coordinate System?
- Mark as New
- Bookmark
- Subscribe
- Mute
- Subscribe to RSS Feed
- Permalink
Projecting the layer on the fly is not same as reprojecting the datasets (Properties > Coordinate System) to the same Projected Coordinate System.
I suggest you give it a try, and see how the results come.
By the way, what Projection System do the Raster layer and the Feature Zone Layer have?
Think Location
- Mark as New
- Bookmark
- Subscribe
- Mute
- Subscribe to RSS Feed
- Permalink
That makes sense. But when I right-lick any of the two layers in the same map and do (Properties) there is no tab to check the Coordinate systems for those.
However, I could check their files through the Catalog:
* The raster is GCS-WGS-1984 and its projection is Albers-Conical-Equal-Area
* The feature layer is NAD 1983 with no projection.
Do you suggest that I change my feature layer into the same as the raster, and then put them both inside a map with the same projection? (I just checked Batch Project in Geoprocessing toolbar, and it seems to work only on feature layer).
(Since I am extracting areas it also makes more sense to change everything into the same system as my raster. Is this correct?)
Thank you very much for your help.
- Mark as New
- Bookmark
- Subscribe
- Mute
- Subscribe to RSS Feed
- Permalink
I remember in ArcMap one could open the files in Catalog and changed their GCS and projections. But ArcGIS pro does not come with Catalog separated?
- Mark as New
- Bookmark
- Subscribe
- Mute
- Subscribe to RSS Feed
- Permalink
That makes sense. Both your data are in different datums. You may Project the Feature Zone Layer to the Albers-Conical-Equal-Area (import from the raster dataset), using an appropriate Transformation Method.
The workflow you just mentioned about, in ArcCatalog, that's same as Define Projection. We are not doing that.
Think Location
- Mark as New
- Bookmark
- Subscribe
- Mute
- Subscribe to RSS Feed
- Permalink
This is really strange. I did what you suggested. Changed my feature layer into the same projection as my raster with the appropriate transformation method that ArcGIS correctly distinguished. Still the result is far from being correct. Still Florida has the highest and Texas and Iowa (that should be on top) are in the middle of the list!!
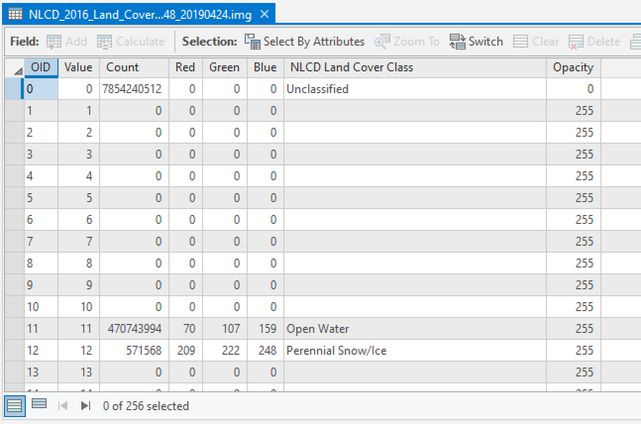
I am re-running with this change: Instead of using the Land Cover class below, I am using value as the Class Field! (I don't know what else is wrong). Would appreciate if you have any suggestions.
- Mark as New
- Bookmark
- Subscribe
- Mute
- Subscribe to RSS Feed
- Permalink
And magically, it solved the problem (using 'Value' instead of 'NLCD Land Cover Class' in the picture above)!!
Not only the ranks make sense now (Iowa, Kansas, North Dakota,...), but the percentage is logical! (the total percentages of crop lands used to be below 1%).!!!

