- Home
- :
- All Communities
- :
- Developers
- :
- JavaScript Maps SDK
- :
- JavaScript Maps SDK Questions
- :
- Re: Create ellipse from json array.
- Subscribe to RSS Feed
- Mark Topic as New
- Mark Topic as Read
- Float this Topic for Current User
- Bookmark
- Subscribe
- Mute
- Printer Friendly Page
- Mark as New
- Bookmark
- Subscribe
- Mute
- Subscribe to RSS Feed
- Permalink
I’ve got an array of points that include location information, as well as information that defines a geographical ellipse. Although I can plot the points via lat/lon, I’m not sure how to draw an ellipse with the data.
The data includes the following information, per point (which is the center of the ellipse):
Latitude
Longitude
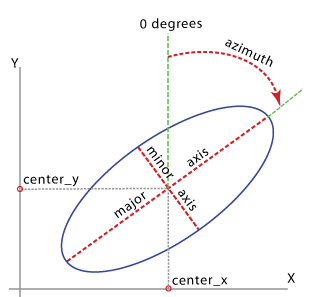
Ellipse Bearing (bearing of the major axis of the ellipse from true north)
Major (width in meters of the ellipse along the major axis)
Minor (width in meters of the ellipse along the perpendicular axis)
Sample data set:
[{“lat”: 33.678265, “lon”: -86.337571, “bearing”: 76, “major”: 465, “minor”: 411},
{“lat”: 33.6779101, “lon”: -86.3448787, “bearing”: 130, “major”: 599, “minor”: 481}]
It would appear from what I’ve looked at online that there are two possible solutions…either calculate a polygon that emulates the ellipse, or to draw it with a library like DOJO. I’m not skilled at custom programming, and I’m wondering if someone could help me come up with a function that accomplishes either giving a polygon that I can add to the map to emulate the ellipse, or a function that utilizes DOJO to accurately draw the ellipse to scale on the map. Thank you for any suggestions.
Solved! Go to Solution.
Accepted Solutions
- Mark as New
- Bookmark
- Subscribe
- Mute
- Subscribe to RSS Feed
- Permalink
Here's a Python implementation that should be mostly portable to JavaScript:
>>> h = 1000 # x coord of ellipse centre
... k = 100 # y coord of ellipse centre
... a = 5 # unrotated x axis
... b = 10 # unrotated y axis
... ang = math.radians(45) # rotation, counter-clockwise, from north
... points = []
... for i in range(360): # one point per degree, change if you wish
...     t = math.radians(i) # ellipse math
...     x = a*math.cos(t) # ellipse math
...     y = b*math.sin(t) # ellipse math
...     rot_x = h+(x*math.cos(ang))-(y*math.sin(ang)) # rotate/transpose ellipse
...     rot_y = k+(y*math.cos(ang))+(x*math.sin(ang)) # rotate/transpose ellipse
...     points.append(arcpy.PointGeometry(arcpy.Point(rot_x,rot_y))) # save points to list
... arcpy.CopyFeatures_management(points,r'in_memory\points') # save points to disk

Helpful links:
- Mark as New
- Bookmark
- Subscribe
- Mute
- Subscribe to RSS Feed
- Permalink
Not sure if this will help or not, but here is an example of drawing an ellipse given axis values (maxWidth & maxHeight). It uses paperjs but the math should be the same regardless.
The main meat of the code is:
if (counter<885)
{
t = (Math.sin(counter * (180/Math.PI)/10800) * Math.PI) + Math.PI;
x = (maxWidth/2) + a * Math.cos(t);
y = (maxHeight/2) + b * Math.sin(t);
path.add(new Point(x,y));
counter++;
}
edit: I essentially stole the idea from this Wikipedia page, which includes it and other methods.
edit 2: I see you need to rotate the ellipse by a bearing. My example will not do that.
- Mark as New
- Bookmark
- Subscribe
- Mute
- Subscribe to RSS Feed
- Permalink
I think there are a few things to bear in mind:
- the center of the ellipse is in decimal degrees, probably WGS84, but the major and minor axis are most likely in other units. You will probably has to project the data, create the ellipse and project back to WGS to make it work
- I think the snippet provided by Darren does not include rotation (bearing)
- Mark as New
- Bookmark
- Subscribe
- Mute
- Subscribe to RSS Feed
- Permalink
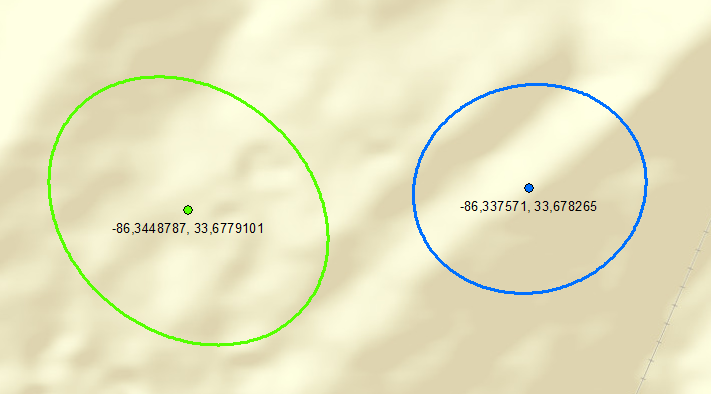
Maybe the easiest way of doing this would be to create a simple geoprocessing service that takes the "table" with ellipse definitions and throws back the ellipses using the tool Table to Ellipse:
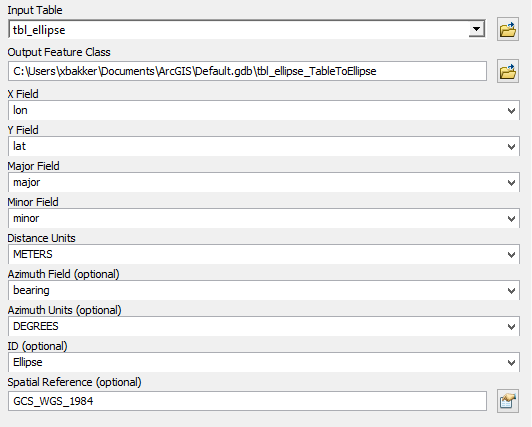
This tool takes into account that your XY may be specified as degrees and the definitions can be metric.
Is the bearing specified as geograhic rotation (clockwise starting North with 0°?)
- Mark as New
- Bookmark
- Subscribe
- Mute
- Subscribe to RSS Feed
- Permalink
Thank you for your response. I left some of the background out of this adventure to keep from cluttering the original post. I have tried the "Table to Ellipse" tool and you are correct, It does exactly what I need it to do, BUT, by the time i turn it into a geoprocessing service and give it a production size dataset (thousands of points), the performance starts tanking. This is the reason I'm hoping the javascript/graphic approach (or anything else) is the way to go. Thanks again.
- Mark as New
- Bookmark
- Subscribe
- Mute
- Subscribe to RSS Feed
- Permalink
Having thousand of features can create problems for a web application. Do you want to create them as client side graphics?
I did came across some Python code to generate the ellipse (using numpy), but I'm sure there are ways to do this in JavaScript too. The number of ellipses may need some reconsideration.
- Mark as New
- Bookmark
- Subscribe
- Mute
- Subscribe to RSS Feed
- Permalink
Yes, I think client side is the way to go. I imagine it working similar to the way the "Geodesic Buffers" sample works: http://developers.arcgis.com/javascript/samples/ge_geodesic_buffers/. I will test to see if I can throw a large number of points at this sample and see how performance is. Thanks again!
- Mark as New
- Bookmark
- Subscribe
- Mute
- Subscribe to RSS Feed
- Permalink
Sorry to jump on the thread, but I'm having problems serving the TabletoEllipse tool as a GP service - however it seems like it's been successful for you (if slow!). My problem is that the distance parameters seem to turn from string options (e.g. KILOMETERS, METERS) into integers (e.g. 9036) at the service publishing dialogue, which propogates to the service, so it won't run. I was wondering if there was something I was missing on the server side, seems like it's missing a domain lookup or something. Thanks for any help!
- Mark as New
- Bookmark
- Subscribe
- Mute
- Subscribe to RSS Feed
- Permalink
Thank you. This gives me a path to go down. The rotation part of the equation is crucial for this process.
Do you know if there is a supplemental process that can rotate the graphic after it is drawn based on that field? I'm sure i could convert the degrees to radians or change it from an azimuth if I had to.
- Mark as New
- Bookmark
- Subscribe
- Mute
- Subscribe to RSS Feed
- Permalink
Here's a Python implementation that should be mostly portable to JavaScript:
>>> h = 1000 # x coord of ellipse centre
... k = 100 # y coord of ellipse centre
... a = 5 # unrotated x axis
... b = 10 # unrotated y axis
... ang = math.radians(45) # rotation, counter-clockwise, from north
... points = []
... for i in range(360): # one point per degree, change if you wish
...     t = math.radians(i) # ellipse math
...     x = a*math.cos(t) # ellipse math
...     y = b*math.sin(t) # ellipse math
...     rot_x = h+(x*math.cos(ang))-(y*math.sin(ang)) # rotate/transpose ellipse
...     rot_y = k+(y*math.cos(ang))+(x*math.sin(ang)) # rotate/transpose ellipse
...     points.append(arcpy.PointGeometry(arcpy.Point(rot_x,rot_y))) # save points to list
... arcpy.CopyFeatures_management(points,r'in_memory\points') # save points to disk
Helpful links: