- Home
- :
- All Communities
- :
- Products
- :
- ArcGIS for Microsoft
- :
- ArcGIS for Microsoft Fabric
- :
- ArcGIS for Power BI
- :
- ArcGIS for Power BI Questions
- :
- Re: Power bi arcgis map timeline incorrect
- Subscribe to RSS Feed
- Mark Topic as New
- Mark Topic as Read
- Float this Topic for Current User
- Bookmark
- Subscribe
- Mute
- Printer Friendly Page
Power bi arcgis map timeline incorrect
- Mark as New
- Bookmark
- Subscribe
- Mute
- Subscribe to RSS Feed
- Permalink
Hi everyone,
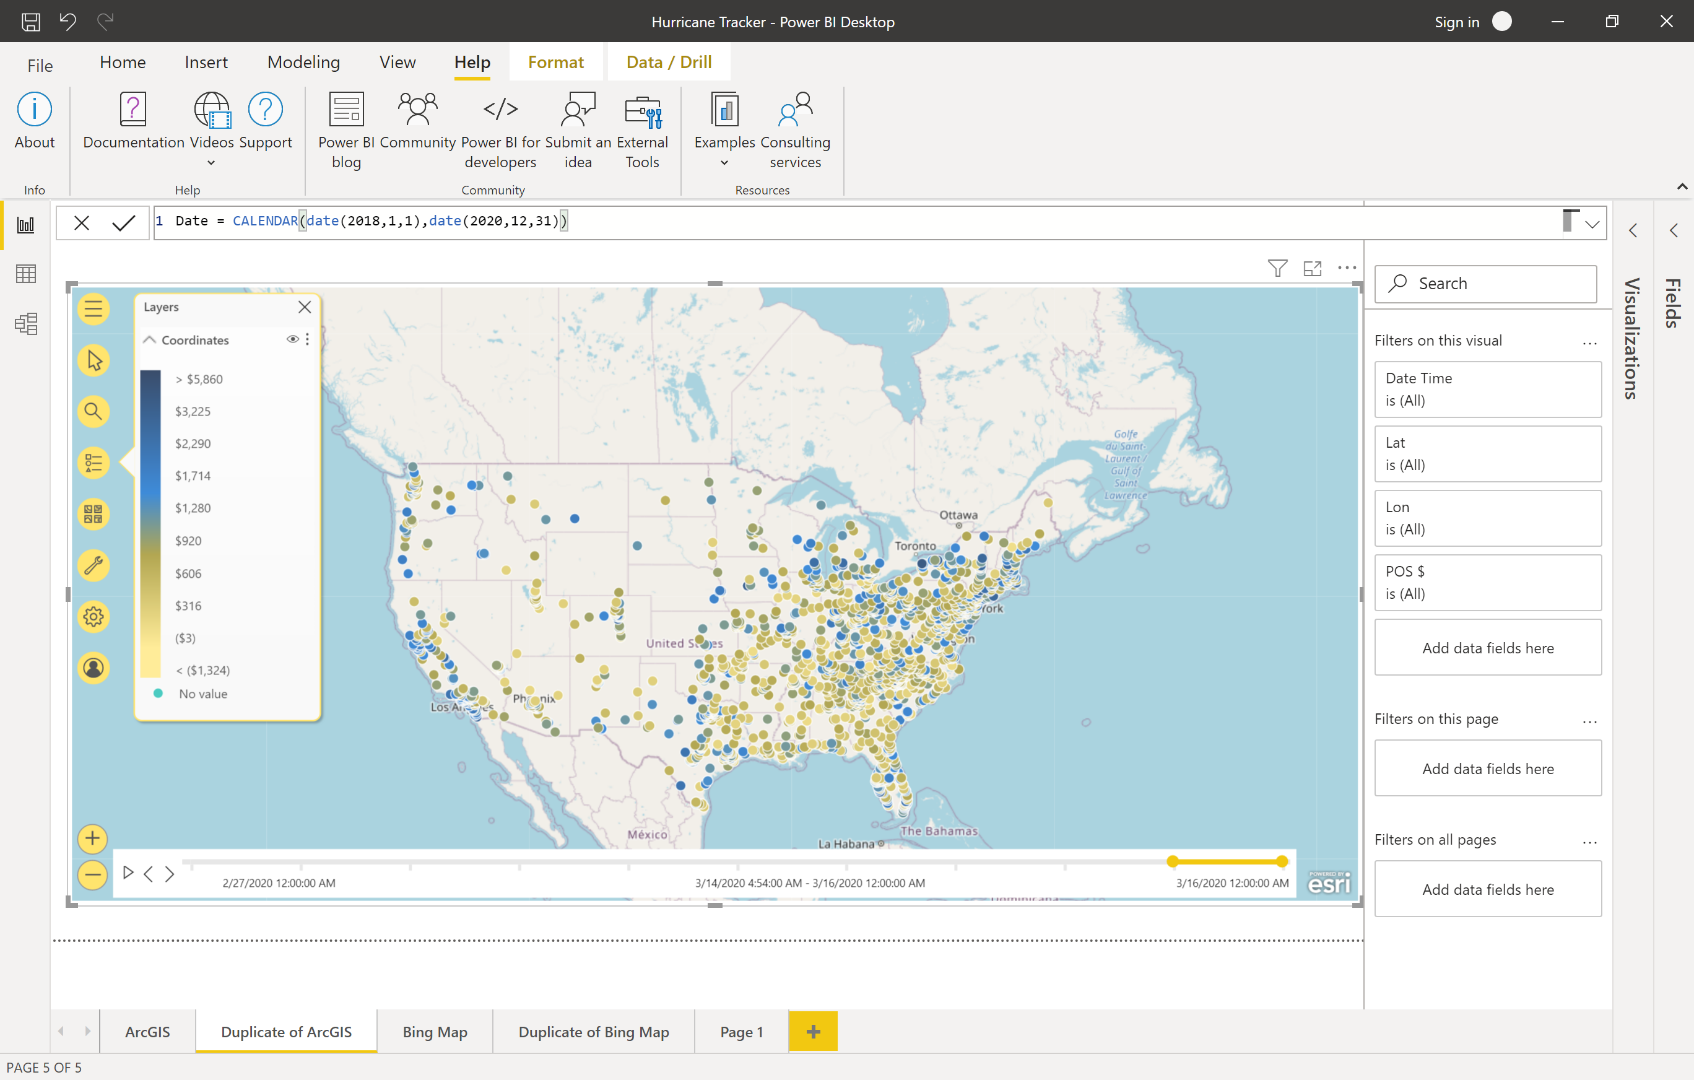
I have been trying to make an arcgis map for days now, in which a heatmap shows how prices in a certain area changed over the years (between 2015 and 2019). However, no matter what I try, I can't get the timeline to the right settings. There is no 1970, yet that is the only range I get on the timeline. 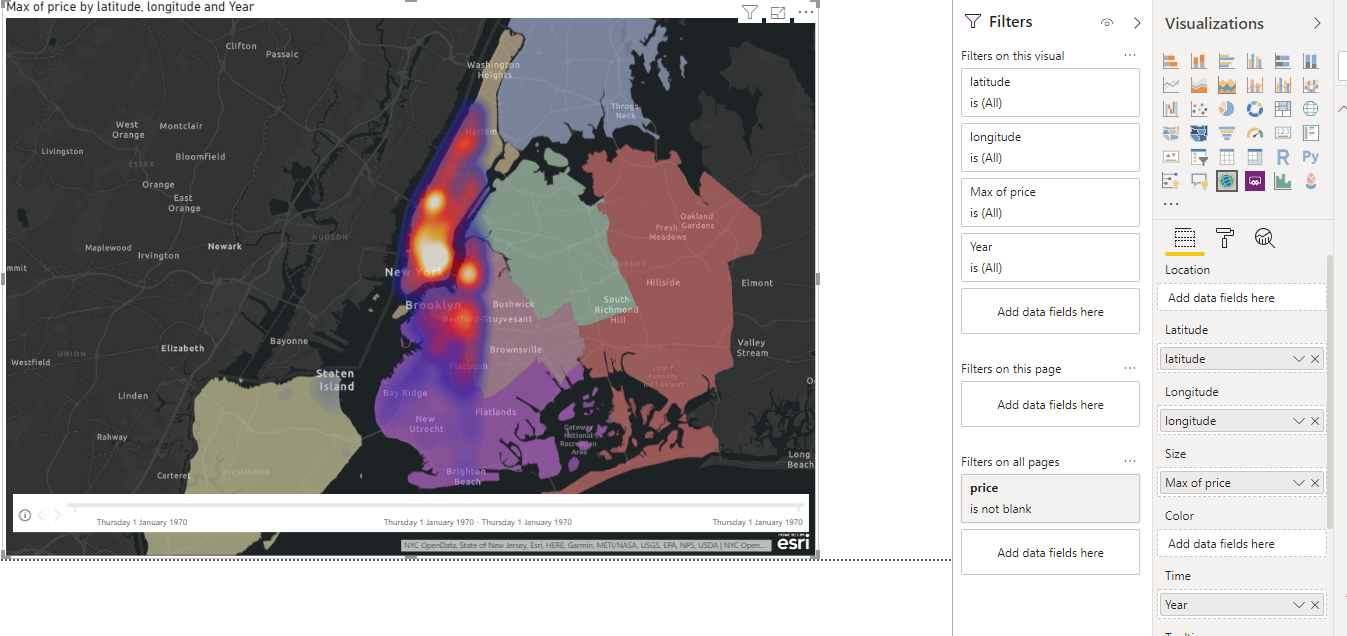
I am fairly certain that my column categories are specified correctly, I even tried with another column that just has Year in it instead of the entire date. 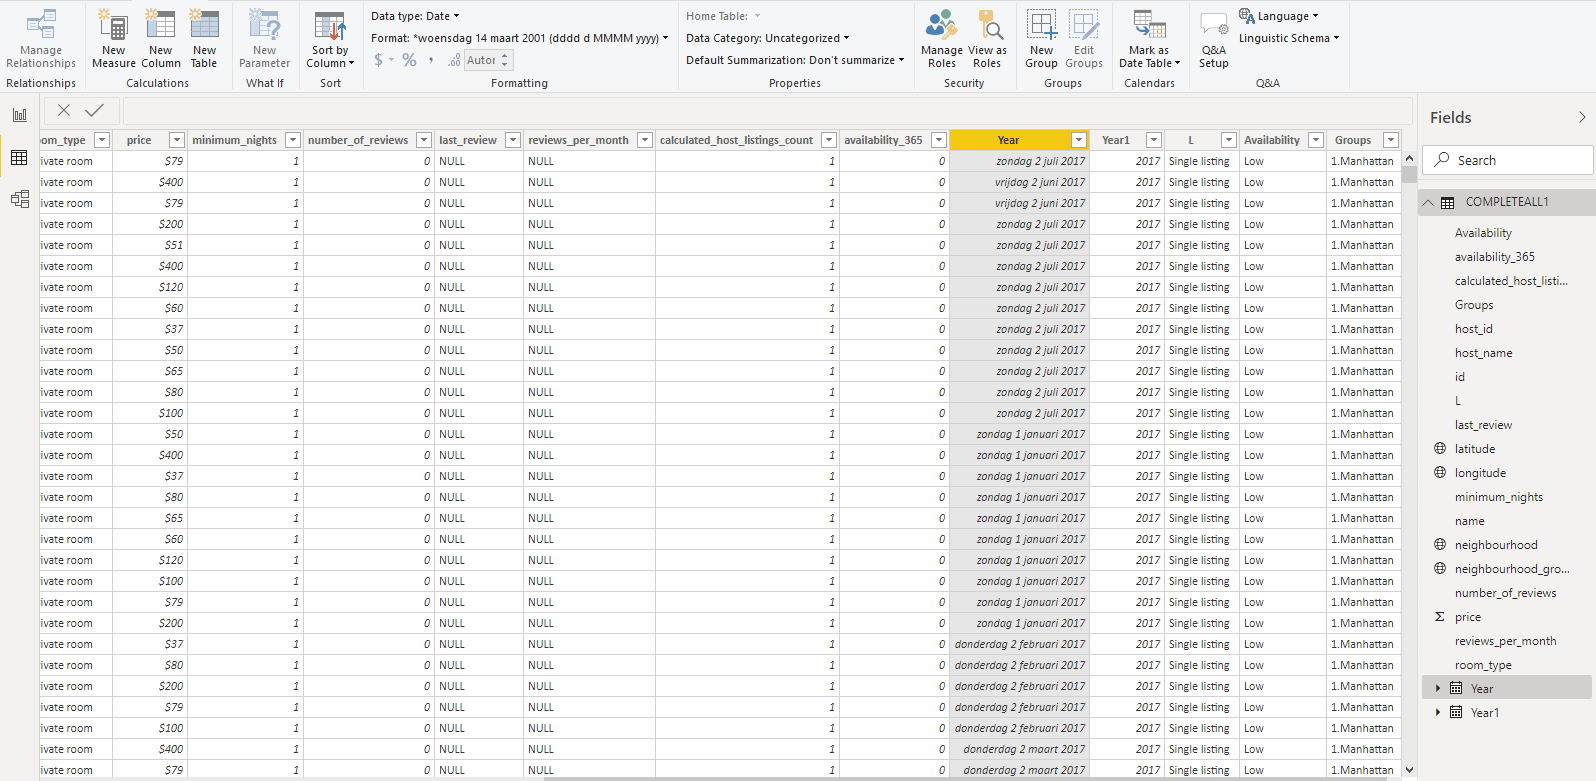
If I apply a filter over the visual in which I, for example, choose to exclude the blank values and show the years 2016-2019, I get a message the start and end date are the same, 2016 is a long interval, and other years are missing. 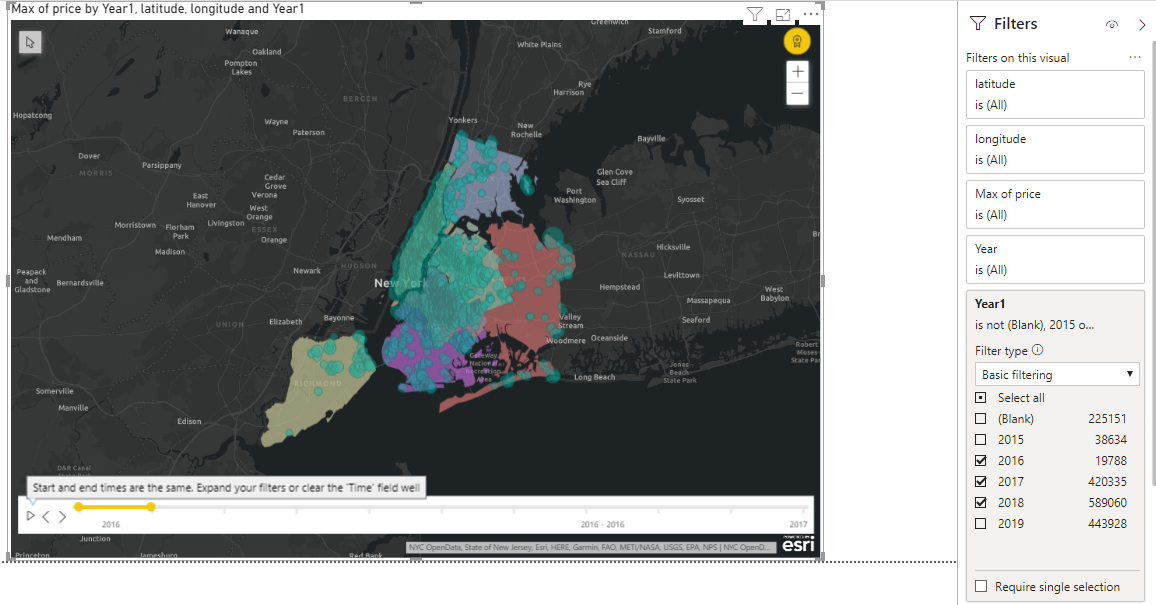
I no longer have any ideas how to work around this. Can anyone help me find a way to fix this?
- Mark as New
- Bookmark
- Subscribe
- Mute
- Subscribe to RSS Feed
- Permalink
I am having this same issue. I have 2 years of daily sales data by location and can only get the timeline to post 2 week periods then it just repeats