- Home
- :
- All Communities
- :
- Products
- :
- ArcGIS for Microsoft
- :
- ArcGIS for Microsoft Fabric
- :
- ArcGIS for Power BI
- :
- ArcGIS for Power BI Questions
- :
- Facing a lot of issues since the last update
- Subscribe to RSS Feed
- Mark Topic as New
- Mark Topic as Read
- Float this Topic for Current User
- Bookmark
- Subscribe
- Mute
- Printer Friendly Page
Facing a lot of issues since the last update
- Mark as New
- Bookmark
- Subscribe
- Mute
- Subscribe to RSS Feed
- Permalink
Since the last update, we are facing the following issues-:
- We select one point from the map to filter other visuals on the dashboard. But it is sending information of a point other than selected to filter the dashboard visuals and calculate the values. This way we are getting incorrect values of our calculations. We have checked and tested thoroughly a lot of times and we are sure that this error is not from our side.
- The Symbology settings of field added inside Power BI keep changing to default even after changing it and saving the file. This happens especially when we interact with filters and slicers on the same dashboard which are not even affecting the map or getting filtered by the map (This we have checked in Edit Interactions feature of Power BI).'
- After interacting with filters and slicers which are not filtering or getting filtered by the map, the map automatically zooms out to the max.
- I want to make the layer of field added inside Power BI to be invisible but clickable so that it can filter other visuals on the dashboard. So I set its transparency to 100 in the Symbology settings so that they are invisible but clickable. But after setting the transparency to 100, the layer added inside Power BI stops being visible and clickable at the same time. Nothing happens when I click on the points in the map. So I have to set the transparency to 99 to make it work but it compromises invisibility of the layer.
Can anyone help me resolve at least the 1st issue on urgent basis, if not all.
- Mark as New
- Bookmark
- Subscribe
- Mute
- Subscribe to RSS Feed
- Permalink
I too am having similar issues, and am concerned as to what these disruptions might mean for published reports. A strange one I'll add to the list, but is related to a few of the mentioned issues:
- I use a map for drill-throughs. If I click on an area for a drill-through, the drill-through target displays something else (e.g., I click on Canada, and the drill-through target report shows France). The map was working well for drill-throughs before the recent changes.
No fix on my end yet either, unfortunately.
- Mark as New
- Bookmark
- Subscribe
- Mute
- Subscribe to RSS Feed
- Permalink
I would like to surface this issue and add a few more comments as well. The new update has thrown off a lot of our reports and it has been really frustrating trying to deal with all the issues that have popped up. And the fact that the visual has been jumping back and forth between the new and old version has resulted in us having to fix our maps several times. Some of our many issues are listed below as follows:
1. My boundary map (which uses SA1 levels) no longer works and is stuck in an infinite loading loop and the visual simply displays unintelligible triangles.
2. Within the boundary map, the settings keep changing to the default ones every time a slicer is picked. It also keeps forgetting the Symbology contains a colour.
3. Despite picking the correct field with the SA1 codes, which worked flawlessly in the previous version, the new version keeps throwing "The accuracy of your locations can be improved. Go to location type" error several times.
4. The heatmap symbology looks drastically worse than the previous version. The transparency effects are gone and it resembles a massive blob on the map.
5. The maps go blank every time I re-open the report. The only fix I have found is to remove the value field and re-add the field to the visual to force a refresh of the visual.
Things I have tried so far:
1. Rebooted my system several times.
2. Made sure my Power BI client is updated to the latest version.
3. Cleared cache within Power BI
We have business critical reports running using this map visual and it is extremely disappointing to see how they have released this version with the amount of bugs we have seen.
- Mark as New
- Bookmark
- Subscribe
- Mute
- Subscribe to RSS Feed
- Permalink
Thank you for posting this and sending the screenshots. We'll take a look at this to see what we can include in our release next month.
- Mark as New
- Bookmark
- Subscribe
- Mute
- Subscribe to RSS Feed
- Permalink
I would like to also raise this topic again.
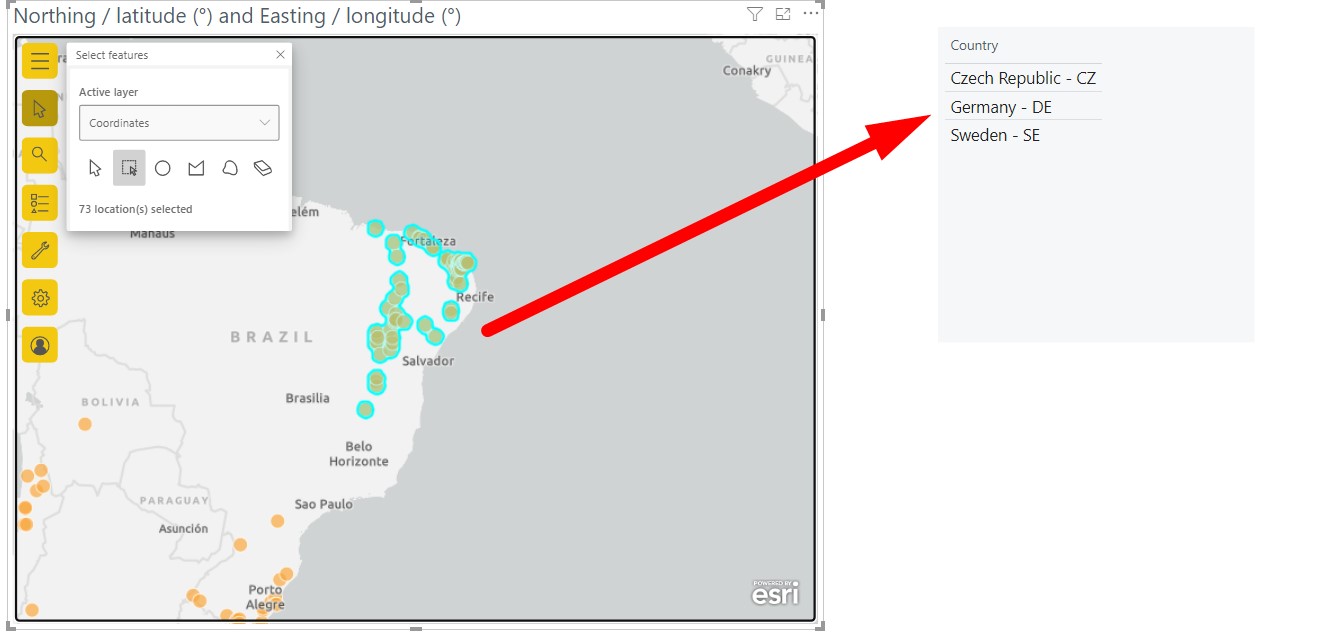
Yesterday I noticed that the new visual has been updated again.... just to notice that it is causing even more trouble. For example, when selecting an area to filter other visuals, I noticed the selection is not consistent... for example, selecting an area in Brazil showed some entries in Germany, France, etc...
I think this is similar to the problem reported by Hoover_ODOT....
Basically this breaks completely my report....
I wish I had the chance to use the old visual version until the new version is tested and validated....
- Mark as New
- Bookmark
- Subscribe
- Mute
- Subscribe to RSS Feed
- Permalink
I am experiencing these bugs as well. The symbology settings reverting randomly and the inaccurate cross filtering are deal breakers as these are the reason I am using this visual. Looks like it's time for the developers to roll back to a stable version.
- Mark as New
- Bookmark
- Subscribe
- Mute
- Subscribe to RSS Feed
- Permalink
We're on the symbology settings reverting back as well as several other issues to be addressed in a release next month.
This release was a significant update, where we updated major components to improve performance, and so that we are set for a better future moving forward. We do a significant amount of testing and are working hard to handle the priority issues as they come in.
We will make sure to post a change log to show what's been fixed next month, and please keep letting us know what issues you are experiencing.
Thank you,
Andrew
- Mark as New
- Bookmark
- Subscribe
- Mute
- Subscribe to RSS Feed
- Permalink
I'm extremely relieved to see that I'm not experiencing similar issues in isolation. Specific concerns in my implementation:
- Cross-element filters on a heat map (click on a table value to filter mapped values): prior to the update, the color scale would automatically adjust to the new range of values. Post-update, the scale appears to stay locked, resulting in a useless heat map. The much smaller, filtered values all fall into the same classification.
- Symbol style reverts after every save/close.
Looking forward to the fixes. This is a critical functionality for our use-case.
- Mark as New
- Bookmark
- Subscribe
- Mute
- Subscribe to RSS Feed
- Permalink
Thank you for reporting that, we'll take a look at the heatmap issue.
Symbology reverts should be addressed in the next release.
- Mark as New
- Bookmark
- Subscribe
- Mute
- Subscribe to RSS Feed
- Permalink
When is the release addressing Symbology reverts occuring?