- Home
- :
- All Communities
- :
- Products
- :
- ArcGIS Dashboards
- :
- ArcGIS Dashboards Questions
- :
- Including blank values for a serial chart in Dashb...
- Subscribe to RSS Feed
- Mark Topic as New
- Mark Topic as Read
- Float this Topic for Current User
- Bookmark
- Subscribe
- Mute
- Printer Friendly Page
Including blank values for a serial chart in Dashboard
- Mark as New
- Bookmark
- Subscribe
- Mute
- Subscribe to RSS Feed
- Permalink
Hi, I am using the serial chart widget in a dashboard and while it is easy to bring in values of existing features, I want to show all in my domain, even if it is blank. That might not make sense.I'll try to include a screenshot.
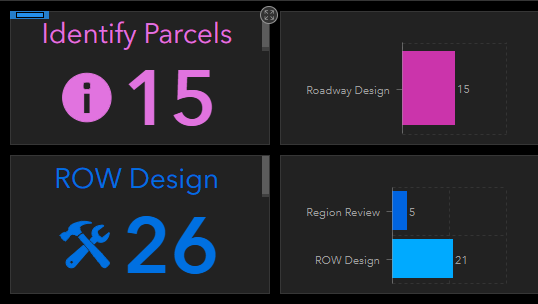
In my two serial charts on the right, for the above one, I want to show the 'roadway design' and another bar, but that other bar needs to have zero (0) for its value. Same for the bottom chart - I want to add one more attribute with a zero value so users will know it's there. Is that possible?
It seems that I can add as many categories as I want but it the category has zero features, then it won't show. Am I missing a check box somewhere that says "show even if it has zero features"?
Thanks in advance. Tagging the dashboard mastermind Derek Law
- Mark as New
- Bookmark
- Subscribe
- Mute
- Subscribe to RSS Feed
- Permalink
For anyone that is having a similar problem, I have found an additional minor workaround utilizing ArcGIS Arcade. As an FYI, this workaround builds a new table/featureset in Arcade and will remove any dynamic connectivity from the original data.
- Create a new serial chart
- Use the "Data expressions" section when choosing data
- Build a new data expression
- Access original data layer using "FeatureSetByPortalItem" function
- Use "Filter" function to find records that match specific category criteria
- Use "Count" function to create integer variable to count instances of records from step 5
- Build JSON string of a blank featureset using the name of the categories and the count of records from step 6 to populate the JSON string.
- Use JSON string from step 7 to create a new featureset using "FeatureSet" function
- Build serial using new featureset
See attached images/code for the Arcade Expression and the configuration of the serial chart
- Mark as New
- Bookmark
- Subscribe
- Mute
- Subscribe to RSS Feed
- Permalink
Alright y'all, I think I have solved my own problem with some creativity and without using JSON or other Arcade like coding.
In ArcGIS Pro, if I add an empty row at the bottom of my attribute table (without adding any geometry - by clicking "Click to add new row"):

I can populate that row with the values of my domain. Doing this, I can make every value show up in my attribute table, and then republish my map. Those values now exist without any polygon data.
Now, in order to make them show up in the Serial Chart on dashboards, I just tell it to do a count of my main identifying value (which for me is the "ownership number"):

And voila! I now have "zero" values for all the attributes I want to show in my serial chart!

I hope this helps some of y'all!
One thing to point out, I was using object_id as my counting variable. If I continued to use object_id, it would count all my records and I would not have zero values. It would look something like this:

- Mark as New
- Bookmark
- Subscribe
- Mute
- Subscribe to RSS Feed
- Permalink
Hi Adrian,
I am working through this same issue and am intrigued with your workflow. Could you please expand on where you entered your domains into the new (non-spatial) row? Are you entering all of your domain values into a single row or is each domain value in its own row?
Thanks,
Craig
- Mark as New
- Bookmark
- Subscribe
- Mute
- Subscribe to RSS Feed
- Permalink
Hi Craig,
In my non-spatial rows, the domains are still in the same field. All fields are valid data entry points so that you can put whatever and still have it behave with domain rules, if that makes sense. Each domain is on a new row. To illustrate, here is a screen shot of the bottom of my attribute table. The highlighted rows all have no geometry:

Let me know if you have more questions.
- Mark as New
- Bookmark
- Subscribe
- Mute
- Subscribe to RSS Feed
- Permalink
Thanks for the reply Adrian. I do have one additional question. I tried doing a test with some data add added the domains into a 'Blotter' field. These are non-spatial. I then used the 'Activity' field as my counting variable. This is the field that I have all my spatial data (my identifying data). However, my dashboard only seems to be using the 'Blotter' field and since I added each attribute in once, it is only displaying it as 1 in my chart. I cannot figure out what I am I doing wrong. Thanks again!

- Mark as New
- Bookmark
- Subscribe
- Mute
- Subscribe to RSS Feed
- Permalink
Hmm, that is a little tricky. Thanks for sharing your screenshot. This is what my full setup looks like:

For my chart, it looks for anything with a "stage" value of "Acquisition". In my table itself, there are 10 rows with this value. But for counting, it is looking for anything with "ownership number". Only 7 of those 10 rows have a value in ownership number. The other 3 are <null>. One more thing to point out, I am symbolizing my chart by a field called "Status1" so it is not using "stage" or "ownership number". I wonder if that makes a difference.
Does this help? I would play around with the different variables and make sure the counting one has a null value where you want it to show zero. Let me know what you find out.
- Mark as New
- Bookmark
- Subscribe
- Mute
- Subscribe to RSS Feed
- Permalink
Adrian,
Thanks for the additional information. For some reason I am still getting a result of 1 even when my counting variable is null. I'll keep playing around with this and see if I can determine the correct workflow.
Thanks again.
- Mark as New
- Bookmark
- Subscribe
- Mute
- Subscribe to RSS Feed
- Permalink
That's the hard part; the try-and-test method! Maybe that "is not null" value in the filter is causing issues? I would try messing with the filter, the category field, and the counting field, just to try and force it to show you what you want to see.
Maybe also another thing to check, is to fully make sure your data table is showing you what you need it to show you (you can click on "Show data table" at the top).
In my table, I can see that three of my "ownership numbers" have no value, or a null value here:

- « Previous
-
- 1
- 2
- Next »
- « Previous
-
- 1
- 2
- Next »