- Home
- :
- All Communities
- :
- Industries
- :
- Education
- :
- Education Blog
- :
- Analyzing change over space and time with the Wayb...
Analyzing change over space and time with the Wayback Image Service
- Subscribe to RSS Feed
- Mark as New
- Mark as Read
- Bookmark
- Subscribe
- Printer Friendly Page
Many educators, researchers, students, and analysts regularly want to examine changes-over-space-and-time with imagery and GIS. Recently, 81 different dates of historical imagery for the past 5 years were placed inside ArcGIS via the World Imagery Wayback service. For more information, see this essay.
This imagery is accessible in ArcGIS , ArcMap, and ArcGIS Pro. The best place to start is the World Imagery Wayback app. This app, available simply through a web browser – https://livingatlas.arcgis.com/wayback/ - can be used by way of introduction in a university or community college course, or all by itself in a primary or secondary school. A fascinating and an incredible resource for examining land use and land cover change, the wayback image service covers the entire globe. That means you can examine coastal erosion in England, deforestation in Indonesia, urban sprawl just about anywhere, reclamation of mine lands, changes in water levels in reservoirs, agricultural expansion in Saudi Arabia, glacial retreat in Alaska, and much more.
Plus, in keeping with the theme of being critical of the data in GIS in education, and the focus of our book and blog The GIS Guide to Public Domain Data, this app and imagery create a useful "teachable moment." The dates shown on the left side of the app represent the update of the Esri World Imagery service, fed by multiple sources, private and public, from local and global sources. Thus, the date shown does not mean that every location that you examine on the image is current as of that date. I verified this where my own observations in my local area show construction as of June 2018, for example, but that construction does not appear on the image. In addition, several other places I examined from wintertime in the Northern Hemisphere were clearly “leaf-on” and taken during the summer before. Therefore, as always, get familiar with what you are working with. Despite these cautions, the imagery still represents an amazingly useful resource.
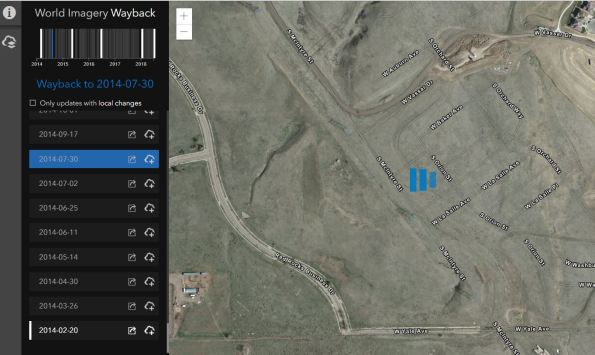
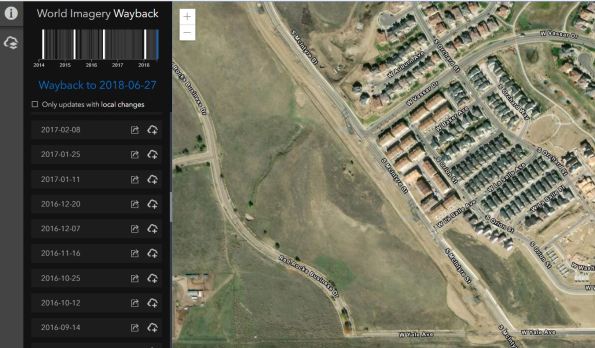
Sample from this imagery set for 30 July 2014 (top) and four years later, 27 June 2018 (bottom) for an area outside Denver, Colorado USA.
How can the use of the Wayback image service be extended for education and research purposes? One way to do so is by creating a web map in ArcGIS from the Wayback app. Doing this will thus enable the user to use all of the functions in ArcGIS with the imagery, such as adding additional map layers (such as hydrography, land use, ecoregions), saving and sharing, using the measurement tools, and creating web mapping applications from the map. To do this:
- Go to the app: https://livingatlas.arcgis.com/wayback/
- Navigate to an area of interest.
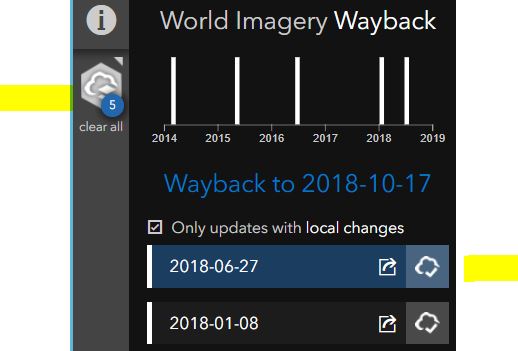
- Check on Only updates with local changes.(shown below)
- Click the cloud icon to “add to cart." (shown below at right).
- Click the clear all icon top left to create a web map (shown below at top left).
- Save the web map.
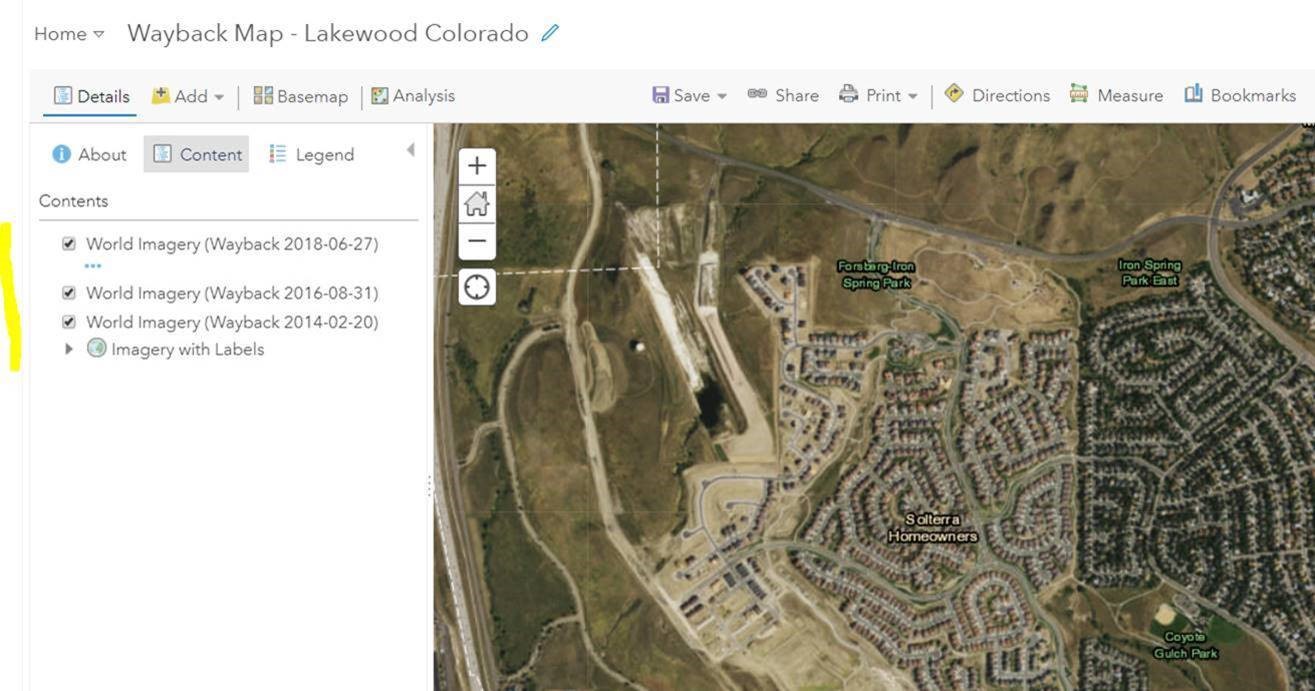
Done! Open your web map. Now you can add layers to your map, including additional Wayback layers. To add the historical wayback imagery to this existing web map, you cannot at the moment add it from a URL as a WMTS layer, but you can use ADD DATA and search in ArcGIS (not Living Atlas), as follows:
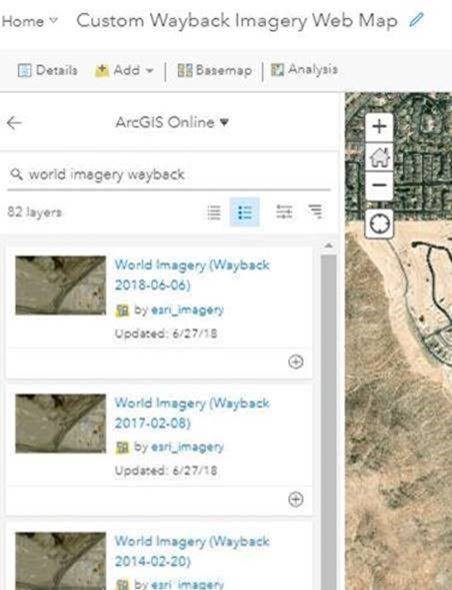
The default sort order is relevance, but you can change it to sort by title or by oldest/newest. See my resulting map with 3 historical layers in it, along with the current image as a basemap, below.
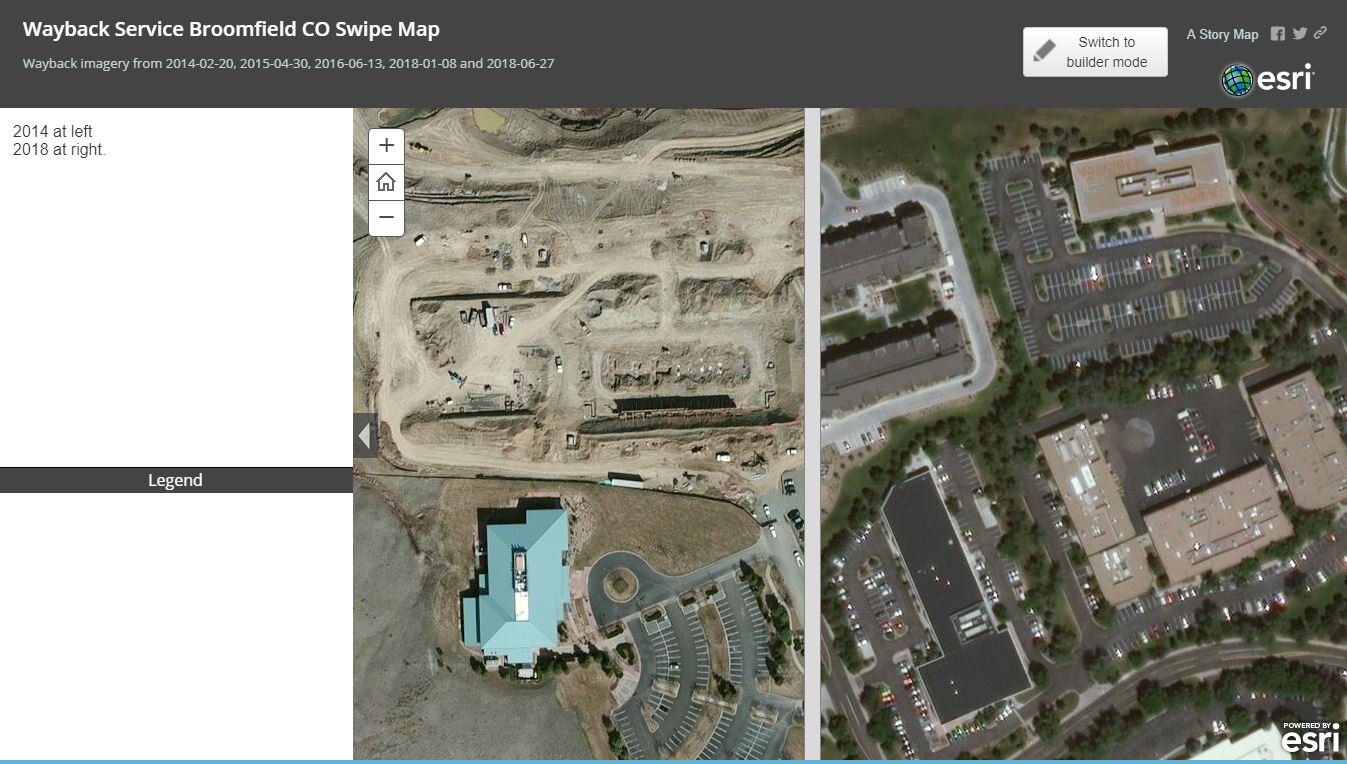
Another way to dig deeper into change-over-space-and-time analysis with the Wayback image service is to create a swipe map. A swipe map is a type of story map application that is perfect for examining change, because it allows the map user to swipe across a map that has, in our study, images with 2 different dates. To create a swipe map, in ArcGIS > Share > Create a web mapping application > choose Swipe map. Select one of the historical image layers for your swipe map, and make sure the basemap is Imagery or Imagery with Labels. The swipe layer (the historical image) will appear on the right with the more recent image on the left.
But let's say your goal is to have the left side be the older imagery, and the right side be the newer imagery. Is that possible? Yes! The swipe map template only allows you to swipe one layer, which by default is the right side. So, you need to make the left side, the basemap, a historical image rather than the default new imagery basemap. To do this, go back to your ArcGIS map and Add > Add from ArcGIS > enter "Wayback" > choose a historical image (in my case, I chose 2014) > Add as basemap. Save your map. In the configuration panel for your story map, change the settings so that you are swiping one of your newer image layers. I did so, and my swipe map is shown below. Here is the URL of the swipe map.
Many other possibilities exist for the use of the Wayback imagery, including using it in 3D scene for a historical perspective on the landscape, using them in a tabbed series story map, using them as a base for advanced analytics in ArcGIS Pro (see my colleague's blog post here about bringing the data into Pro), and in many other ways.
I hope that these ways I describe above encourage you to use and think creatively and spatially with this amazing set of images.
You must be a registered user to add a comment. If you've already registered, sign in. Otherwise, register and sign in.
-
Administration
90 -
Announcements
87 -
Career & Tech Ed
1 -
Curriculum-Learning Resources
285 -
Education Facilities
24 -
Events
77 -
GeoInquiries
1 -
Higher Education
618 -
Informal Education
286 -
Licensing Best Practices
102 -
National Geographic MapMaker
42 -
Pedagogy and Education Theory
241 -
Schools (K - 12)
282 -
Schools (K-12)
307 -
Spatial data
39 -
STEM
3 -
Students - Higher Education
259 -
Students - K-12 Schools
146 -
Success Stories
44 -
TeacherDesk
1 -
Tech Tips
128
- « Previous
- Next »